


1. Introduction
Battery testing is fundamentally a measurement task. Whether evaluating cycle life, coulombic efficiency, voltage response, or degradation mechanisms, the quality of conclusions depends on the quality of the data. Two concepts govern data integrity in any battery test system: accuracy and precision. Although often mentioned together, they describe different aspects of measurement performance. In long-duration battery experiments—where small deviations can accumulate over hundreds or thousands of hours—understanding these differences is essential for obtaining reliable results.
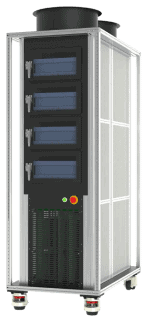
This application note clarifies the meaning of accuracy and precision, explains why both are critical in battery testing, and illustrates practical examples using common test parameters such as voltage, current, and coulombic efficiency. Finally, it highlights how high-quality instrumentation (e.g., Arbin LBT systems with MITS software) helps minimize errors and improve data confidence.
2. What is the difference between accuracy and precision
|
Term |
Meaning |
Practical Interpretation |
|---|---|---|
|
Accuracy |
Closeness to the true value |
“Is the measurement correct?” |
|
Precision |
Repeatability and low variation |
“Is the measurement consistent?” |
Accuracy error shifts all measurements up or down, while precision error causes measurements to scatter. A system can be accurate but not precise, precise but not accurate, both, or neither.
-
Accuracy describes how close a measured value is to the actual or true value
-
Precision describes how consistent repeated measurements are, regardless of their closeness to the true value
A system can be:
|
Case |
Accuracy |
Precision |
|---|---|---|
|
A |
Low |
Low |
|
B |
High |
Low |
|
C |
Low |
High |
|
D |
High |
High (ideal) |
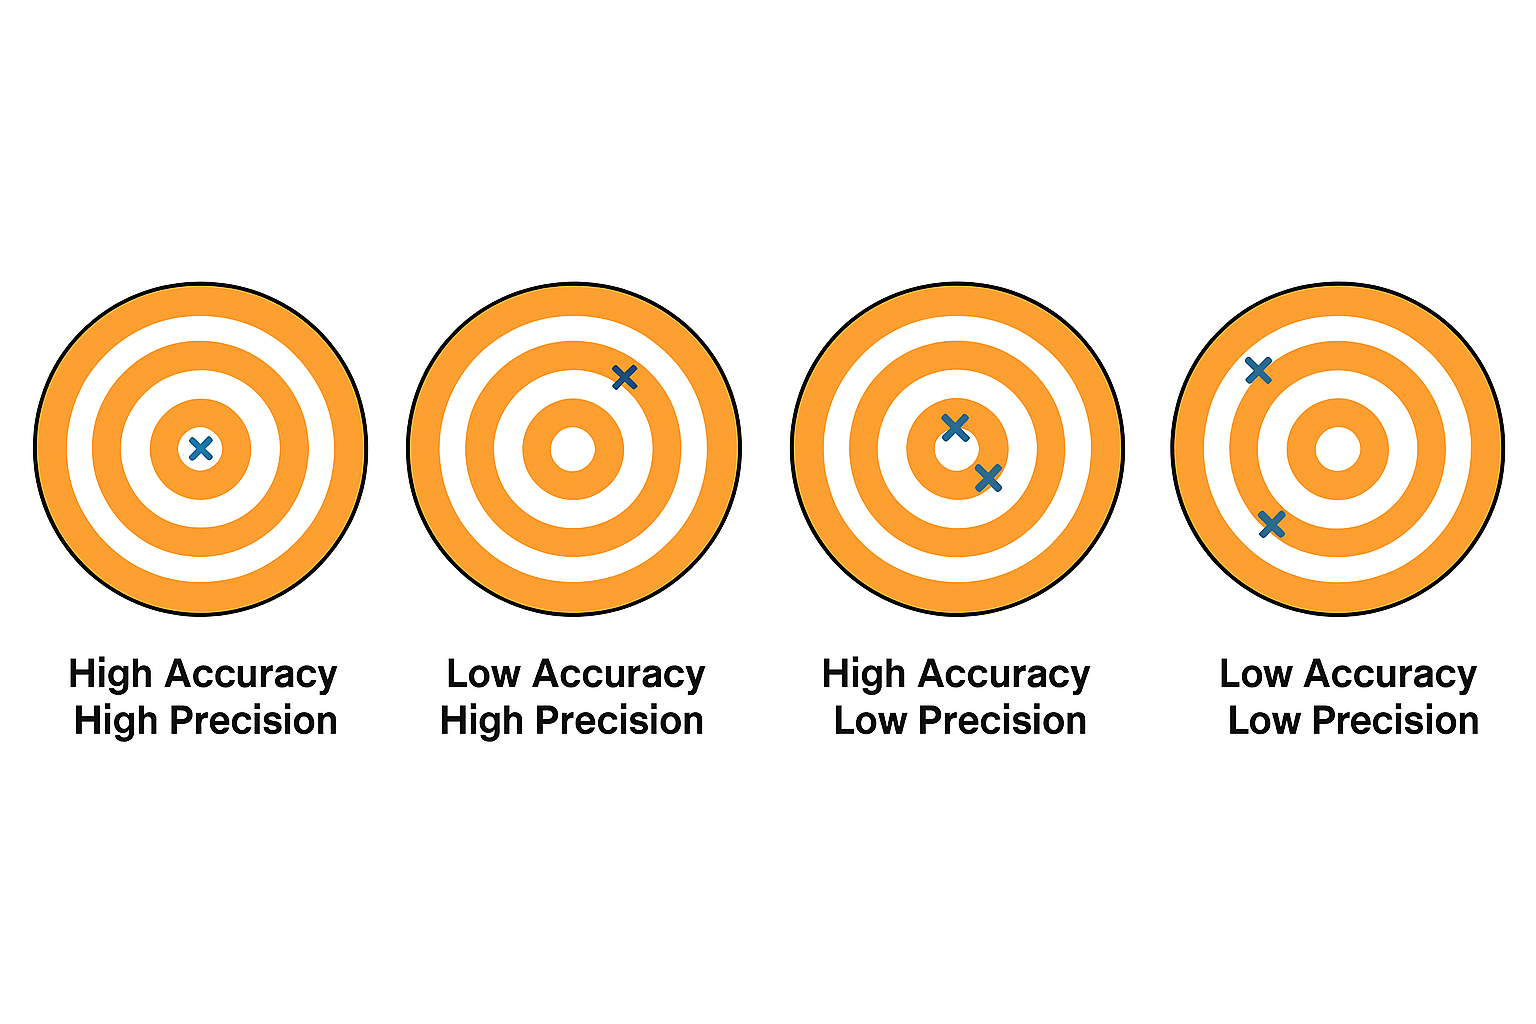
In battery testing, the ideal scenario (D) is required: the tester must deliver values that are both correct and repeatable across thousands of cycles.
3. Why Accuracy and Precision Matter in Battery Testing
|
Metric |
Impact of Poor Accuracy |
Impact of Poor Precision |
|---|---|---|
|
Voltage |
Wrong cut-off triggers → incorrect capacity |
Noisy curves → difficult dV/dt or knee-point analysis |
|
Current |
Incorrect C-rate |
Non-smooth current trace |
|
CE |
Wrong absolute efficiency |
Unable to detect micro-changes (99.94% vs 99.97%) |
|
DCIR |
Shifted absolute value |
Unclear trend behavior |
For long-life chemistries (LFP, NMC, Na-ion), CE drifts as small as 0.01–0.02% can change life-time prediction by hundreds of cycles. This is only visible when the tester has high precision + low noise.
4. Impact on Common Battery Test Parameters
|
Measurement Parameter |
Where Precision Matters |
Where Accuracy Matters |
|---|---|---|
|
Voltage |
Detecting small ΔV in R&D (e.g., GITT) |
Ensuring correct cut-off (prevents overcharge/over-discharge) |
|
Current |
Long-term repeatability for cycle testing |
Correct C-rate for charge/discharge |
|
Coulombic Efficiency |
Distinguishing 99.95% vs 99.90% |
Accurate capacity calculation |
|
IR / DCIR |
Trend clarity over life |
Absolute resistance comparison |
References:
Arbin Instruments. (2021). Battery test system accuracy and calibration white paper. College Station, TX: Arbin Instruments.
Arbin Instruments. (2023). LBT Series product manual (Rev. 2.3). College Station, TX: Arbin Instruments.
ASTM International. (2020). ASTM E177-20: Standard practice for use of the terms precision and bias in ASTM test methods. West Conshohocken, PA: ASTM International. Standard Practice for Use of the Terms Precision and Bias in ASTM Test Methods
IEC. (2018). IEC 62660-1:2018 – Secondary lithium-ion cells for the propulsion of electric road vehicles – Part 1: Performance testing. Geneva, Switzerland: International Electrotechnical Commission.
Newman, J., & Thomas-Alyea, K. E. (2004). Electrochemical systems (3rd ed.). Hoboken, NJ: Wiley-Interscience.

