
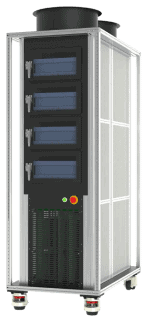


We previously examined the impact of measurement accuracy in an earlier article. In this article, we shift our focus to the influence of a battery tester’s precision on battery research.
In many research applications, parameters such as dV/dt and dQ/dV are widely used. The reliability of these measurements depends heavily on the precision of the battery tester, as small fluctuations or noise in voltage or current can significantly distort their interpretation.
The value of derivative capacity curve:
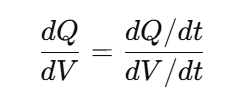
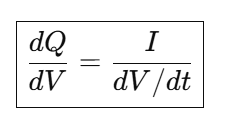
Because dQ/dt = I, we can write:

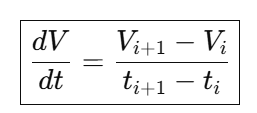
dV/dt can be re-written in details as follows:
-
dV/dt analysis
We can see that in a very short time, even if we assume that the battery voltage is constant in reality, let say V0, the noise can cause a fake ΔV (ΔV = Vi+1 – Vi), resulting a false peak in dV/dt. To be more precise, if we take dt as 1ms, and Voltage is constant during that 1ms, dV/dt =0.
If we take the precision as 0.01% FSR, let’s take the FSR as 10V (From -5V to 5V). Then the absolute value of voltage precision is: 10 * 0.01% = 0.001 V or 1 mV.
We examine the worst case where V i+1 = V0 + 1 mV, Vi = V0 – 1 mV.
Then ΔV = Vi+1 – Vi = (V0 + 1mV) – (V0 – 1 mV) = 2 mV
dV/dt = 1mV/2ms = 0.5 V/s.
The real Voltage is 0 as assumption above, the value of dV/dt should be 0. However, we can see that due to precision limitation, the value of dV/dt measured become 0.5V/s, which is a huge difference.
In reality, the worst case may hardly happen, however, the example above shows us how substantially the precision limitation can cause to the result of dV/dt.
It’s worth highlighting that even with some inaccuracy, if the precision is perfect, the measurement of ΔV is still perfect, because value of both Vi+1 and Vi are shifted equally.
-
dQ/dV analysis:
Because:
We can assume that the accuracy and precision of time measurement is very high and ignore it.
In a very short time, the error of current measurement can be ignored also, therefore the accuracy analysis of dQ/dV and dV/dt are narrowed down to dV/dt accuracy analysis.
Similar to the analysis above, take the example in which dV change in a very short time of 5ms. Let’s say dV= 0.08mV.
In this case dV/dt = 0.08mV/5ms=0.016V/s
With the precision of 1 mV, the dV can easily be distorted from 0.08mV to be 0, causing dV/dt to be 0, and the infinite high in dQ/dV
Case Study: How Voltage Precision Affects dV/dt and dQ/dV Calculation in Battery Analyzers
When analyzing dQ/dV, the system must calculate:
![]()
However, if ΔV is extremely small (tens of µV), measurement noise becomes larger than the real signal. This causes:
-
dV/dt to collapse to zero
-
dQ/dV to spike to extremely large values
-
unusable dQ/dV curves
To avoid this, most battery analyzers (including Arbin) do not compute dV/dt every few milliseconds.
Instead, they wait until the voltage change (ΔV) is larger than a threshold, typically:
![]()
Then they compute one stable dV/dt.
Case Study
Examine a case where after 5ms, the voltage change is ΔV = 0.08 mV (80 µV). Assume that in small time interval, the voltage increase linearly. We calculate the smallest time interval for ΔV to get 10 times of the voltage precision for each type of battery tester.
|
Products |
Voltage precision |
10 times of voltage precision |
Min time interval |
|---|---|---|---|
|
Certain Brand X |
±4 mV |
±40 mV |
2500ms |
|
Voltage precision – LBT5V |
±1 mV |
±10 mV |
625ms |
|
Voltage precision – Arbin HPS |
±120 µV |
±1200 µV = 1.2 ms |
75ms |
Reference
Arbin Instruments. (2021). Battery test system accuracy and calibration white paper. College Station, TX: Arbin Instruments.
Arbin Instruments. (2023). LBT Series product manual (Rev. 2.3). College Station, TX: Arbin Instruments.
ASTM International. (2020). ASTM E177-20: Standard practice for use of the terms precision and bias in ASTM test methods. West Conshohocken, PA: ASTM International. Standard Practice for Use of the Terms Precision and Bias in ASTM Test Methods
IEC. (2018). IEC 62660-1:2018 – Secondary lithium-ion cells for the propulsion of electric road vehicles – Part 1: Performance testing. Geneva, Switzerland: International Electrotechnical Commission.
Newman, J., & Thomas-Alyea, K. E. (2004). Electrochemical systems (3rd ed.). Hoboken, NJ: Wiley-Interscience.

