 English
  简体中文
简体中文  한국어
한국어 



Hybrid Pulse Power Characterization (HPPC) Testing with Arbin MITS Pro
Summary
The Hybrid Pulse Power Characterization (HPPC) test measures the pulse resistance and pulse power capability of a battery across its state-of-charge (SOC) range. This application note describes the HPPC method, the cycler characteristics that determine measurement quality, and an HPPC test on an XCell N18650-35E cell at 90% SOC and 25 °C, performed on an Arbin HPS cycler using a MITS Pro schedule.
1Introduction to HPPC Testing
The HPPC test is defined in the US Department of Energy battery test manuals for hybrid and electric vehicles [1][2]. A short discharge pulse and a short charge (regen) pulse are applied at a series of SOC levels and the voltage response is recorded. The voltage change during each pulse gives the discharge resistance and regen resistance at that SOC, from which the pulse power that the battery can deliver or absorb within its voltage limits is calculated [1].
Capacity measurements quantify stored energy but not the rate at which energy can be delivered or accepted. HPPC provides this information and is used to:
- set the power limits a battery management system (BMS) allows at each SOC;
- parameterise the equivalent circuit models used for SOC and state-of-health estimation [5][6];
- compare cell designs, chemistries or suppliers;
- track resistance growth as a cell ages.
Cell resistance increases and pulse power decreases at lower temperature [4]; HPPC is therefore performed at a controlled temperature and repeated at each temperature of interest.
2HPPC Methodology
2.1HPPC Pulse Profile
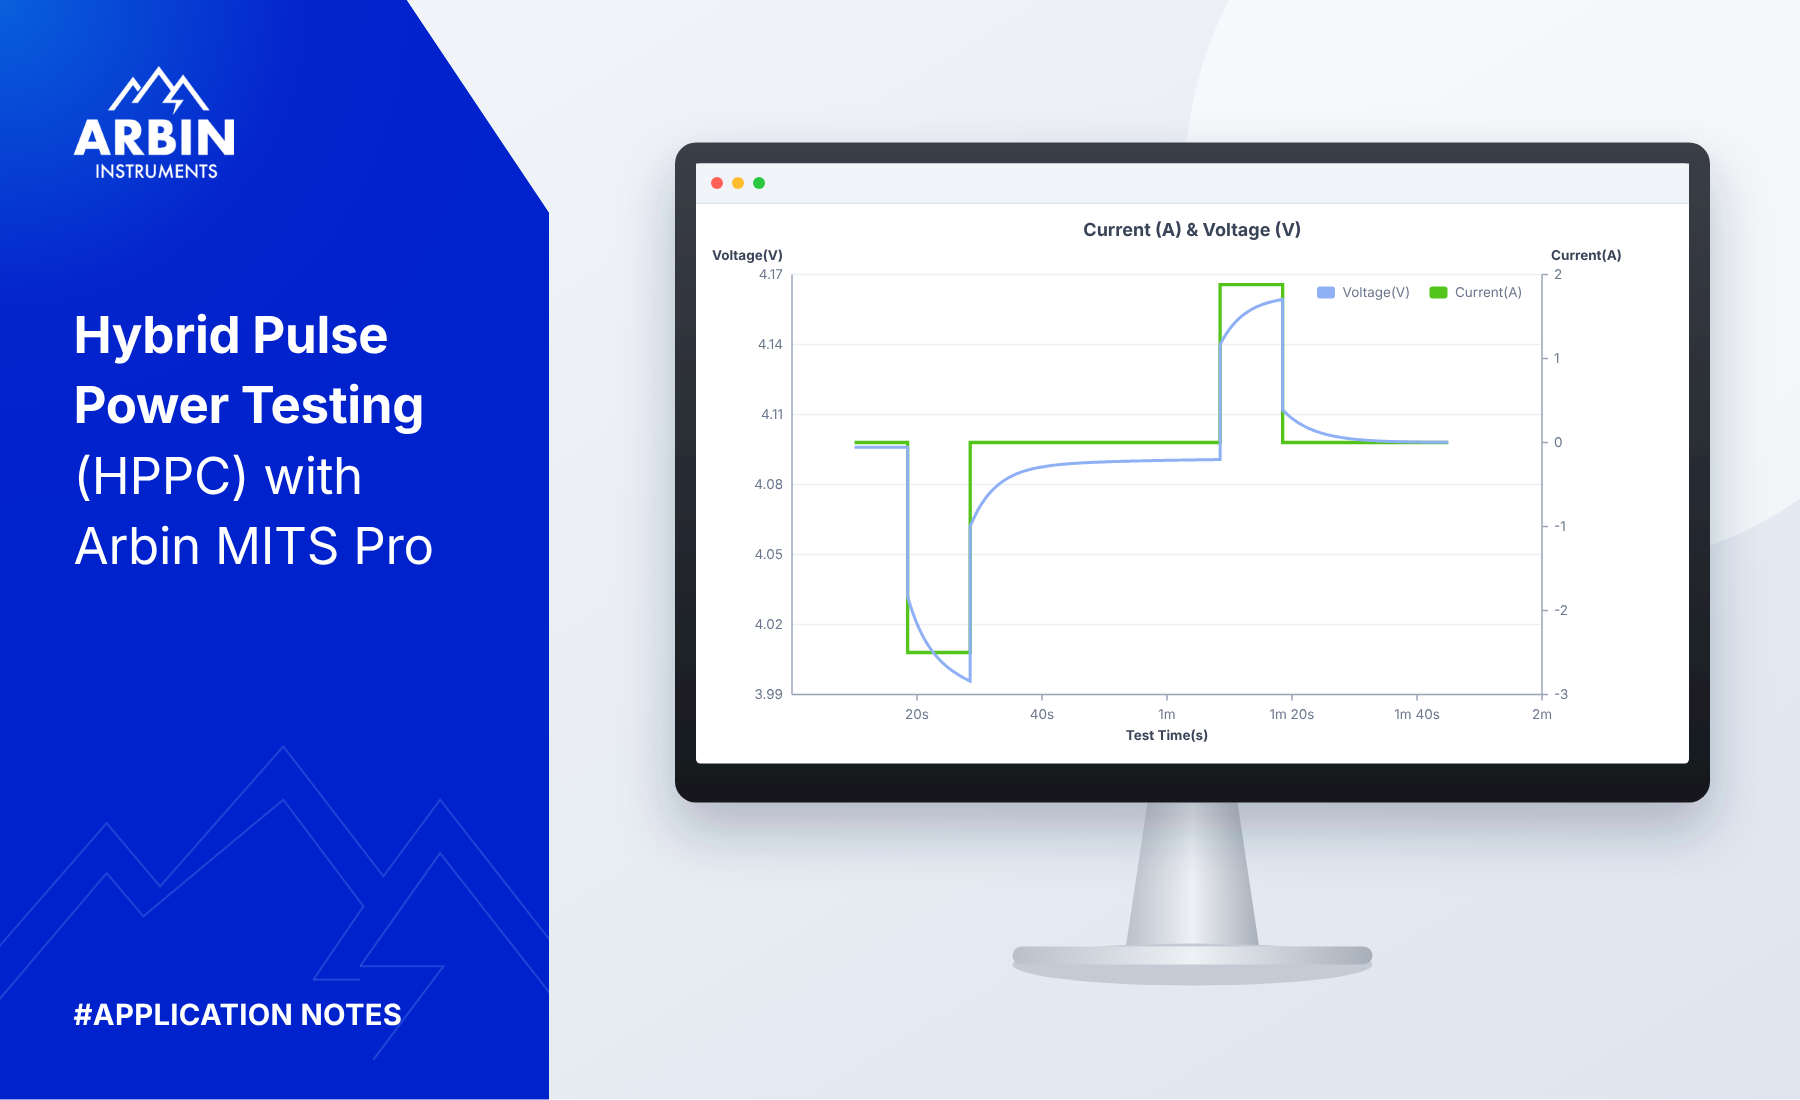
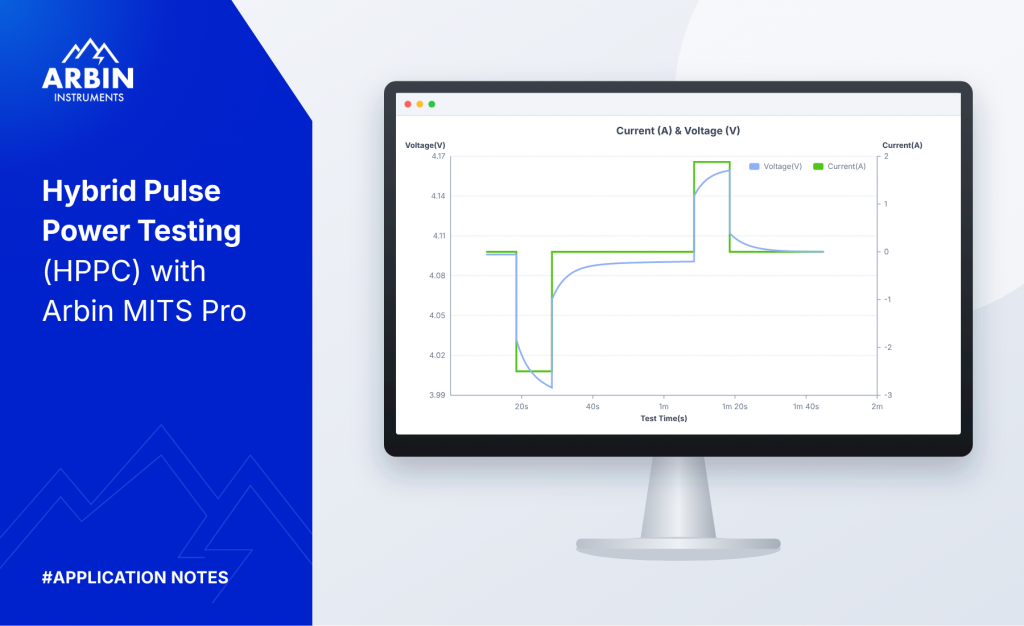
The HPPC pulse profile is a 10-second discharge pulse, a 40-second rest and a 10-second regen pulse at 75% of the discharge current [1][3]. In a full test the profile is applied at every 10% SOC step; between steps the cell is discharged at a constant rate and rested for one hour, so that each pulse starts from a relaxed, near open-circuit condition [1].
Table 1. HPPC pulse profile
| Time increment (s) | Cumulative time (s) | Segment | Relative current |
|---|---|---|---|
| 10 | 10 | Discharge pulse | 1.00 (discharge) |
| 40 | 50 | Rest | 0 |
| 10 | 60 | Regen pulse | 0.75 (charge) |
2.2Pulse Resistance and Power Calculation
With t0 just before the discharge pulse, t1 at the end of the discharge pulse, t2 at the end of the rest and t3 at the end of the regen pulse (Figure 1) [1]:
OCVdis and OCVregen are the rested voltages before the discharge and regen pulses. Plotted against SOC, these values give the resistance and pulse power curves of the cell.
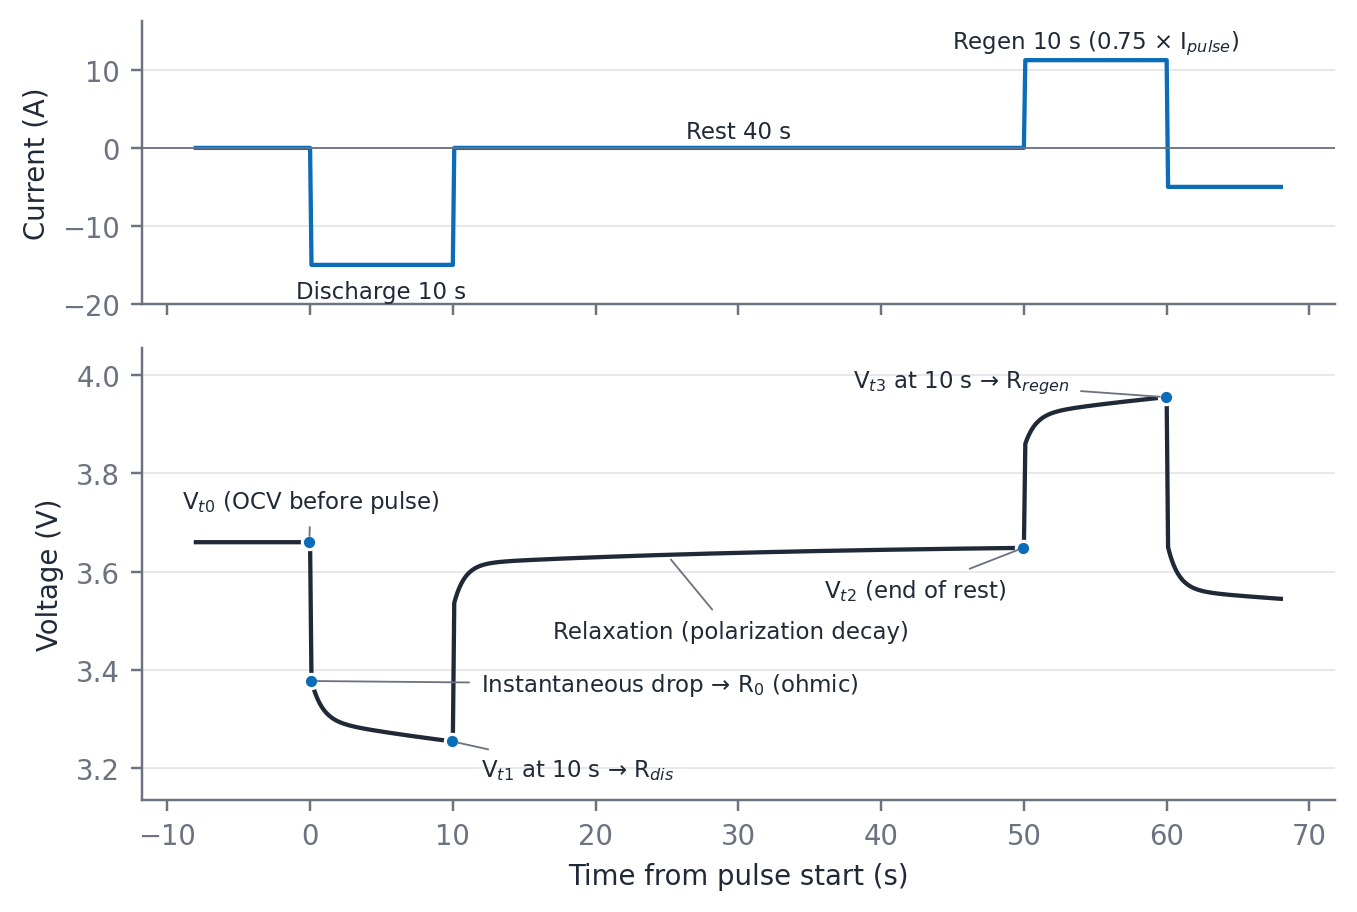
The measured resistance depends on the time at which it is evaluated (for example 1 s or 10 s after the start of the pulse); the evaluation time is therefore reported with the results [7].
3Cycler Requirements for HPPC
HPPC results are calculated from voltage and current readings taken at defined times during fast current steps in both directions. Measurement errors and deviations from the programmed waveform propagate directly into the calculated resistance and power. Table 2 lists the cycler characteristics that affect HPPC results and the corresponding test-setup considerations.
Table 2. Cycler characteristics and test-setup choices that affect HPPC results
| Characteristic | Relevance to HPPC | Test-setup consideration |
|---|---|---|
| Voltage accuracy and resolution | Resistance is the difference of two voltage readings; pulse power also uses the absolute OCV and voltage limits | Insufficient accuracy causes scatter in resistance between channels and repeat tests |
| Current accuracy and range | Resistance divides by the pulse current; SOC steps rely on charge counting | Use the smallest range that covers the pulse; an oversized range multiplies the current error |
| Current rise time and overshoot | Defines when the pulse effectively starts; overshoot can reach voltage limits | Slow rise or overshoot distorts short-time resistance and can trigger limits |
| Sampling and logging rate | Short-time (ohmic) resistance and model fitting need fast data during pulses [7] | Fast logging during pulses, slower logging during rests; combined time- and voltage-based criteria |
| Bipolar (bidirectional) circuitry | The regen pulse follows the discharge pulse within one 60 s sequence | Relay-switched charge/discharge circuits can introduce dead time or transients at the transition |
| Voltage limit handling | Regen at high SOC and discharge at low SOC approach Vmax and Vmin [1] | Step limits in addition to safety limits, so that the channel responds within the step |
| Temperature control and logging | Resistance changes strongly with temperature [4] | Temperature chamber, thermal soak before testing, cell temperature logged with the electrical data |
3.1Test Instrument
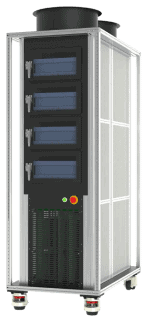
A precision cycler facilitates meeting the requirements in Table 2. The test in this note was performed on an Arbin HPS ultra-high precision cycler with integrated temperature chambers (Figure 2). Its specifications are listed in Table 3 [9].
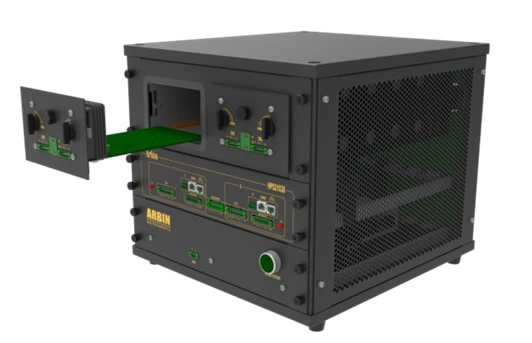
Arbin HPS key specifications [9]
In the integrated-chamber version, each channel has a dedicated chamber (10 to 60 °C, ±0.5 °C stability) and a PT100 input mapped to the channel, so that temperature is controlled and recorded together with the electrical data.
Table 3. Arbin HPS specifications relevant to HPPC [9]
| Requirement | Arbin HPS specification | Relevance to HPPC |
|---|---|---|
| Voltage accuracy and precision | Measurement accuracy ±0.002% FSR (20 ppm); precision ±0.001% FSR (10 ppm, 120 µV); 24-bit measurement | Sub-millivolt resolution of the pulse voltage change |
| Current accuracy and range | Six auto-switching ranges per channel (5 A to 100 µA); control accuracy ±0.005% FSR; measurement accuracy ±0.004% FSR | Each step is measured on a suitable range, from the pulses to the CV taper |
| Rise time | Current rise/fall time ≤ 200 µs; minimum pulse width 2 ms; minimum step time 5 ms | Sharp pulse edges and fine time resolution for short-time resistance |
| Bipolar operation | Bipolar −6 V to +6 V range; charge and discharge on the same channel | Discharge, rest and regen performed as one sequence on one channel |
| Temperature control | Integrated chamber per channel, 10 to 60 °C, ±0.5 °C stability; PT100 input mapped to the channel | Temperature controlled and recorded with the electrical data |
| Software | MITS Pro: 30+ control types, 90+ meta variables, nested loops | HPPC programmed once as a schedule and reused for other cells |
4Cell, Module and Pack Level Testing
HPPC can be performed at cell, module or pack level. The pulse profile is the same at each level; currents, voltages and limits are scaled to the device under test [2].
Table 4. HPPC test levels
| Level | Typical application | Test setup | Arbin systems |
|---|---|---|---|
| Cell | Cell development and selection, model parameterisation, ageing studies | Single channel; cell-level currents and voltage limits | LBT-Cell, RBT-Cell, HPS |
| Module | Module resistance including interconnects | Higher voltage; module limits; cell voltage monitoring | LBTS-Module, RBT-Module |
| Pack | System validation and BMS power-limit verification | Pack-level voltage and power; BMS communication; pack safety limits | RBT-Pack |
The experiment described in this note is performed at cell level.
5Device Under Test: XCell N18650-35E
The device under test is an XCell N18650-35E, a 3350 mAh cylindrical 18650 lithium-ion cell (Figure 3). The datasheet values [8] are listed in Table 5 and were entered in the MITS Pro cell definition.
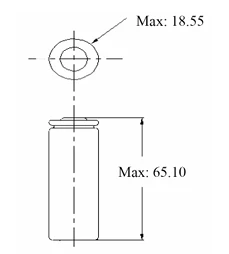
Table 5. XCell N18650-35E datasheet values [8]
| Parameter | Value |
|---|---|
| Nominal / minimum capacity | 3350 mAh / 3250 mAh |
| Nominal voltage | 3.6 V |
| Charge cut-off voltage (Vmax) | 4.20 V |
| Discharge cut-off voltage (Vmin) | 2.50 V |
| Standard charge | CC 0.5C to 4.20 V, CV at 4.20 V until current ≤ 0.01C |
| Maximum charge current | 1C at 25 °C |
| Maximum continuous discharge current | 3C at 25 °C |
| Internal resistance | ≤ 35 mΩ (AC, 1 kHz) |
| Dimensions (max.) | Ø 18.55 mm × 65.10 mm |
| Weight | ≤ 49 g |
| Operating temperature | Charge 0 to 45 °C; discharge −20 to 60 °C |
| Cycle life | ≥ 800 cycles to 80% capacity (1C/1C) |
6Experimental Setup
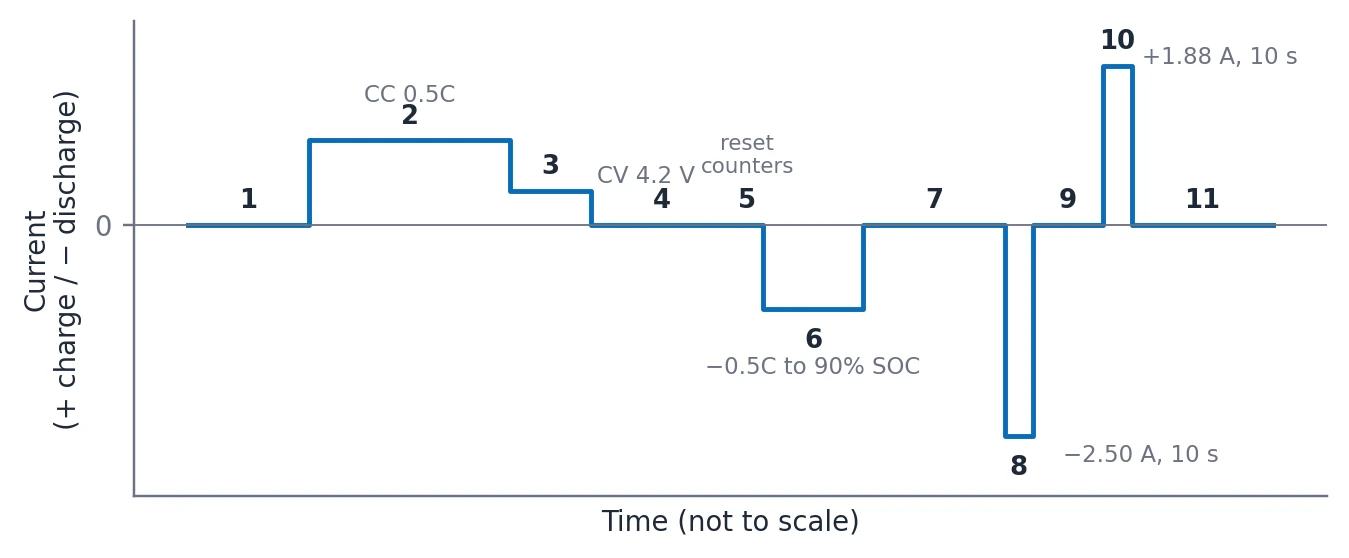
The HPPC pulse sequence is applied at a single SOC point, 90% SOC, with the cell at 25 °C in the integrated chamber of the Arbin HPS. 25 °C lies within the datasheet charge and discharge temperature ranges and is the common reference temperature for HPPC [1][8]. A full SOC sweep is obtained by repeating steps 5 to 11 at each 10% SOC step.
Table 6. Test conditions
| Condition | Value |
|---|---|
| Equipment | Arbin HPS with integrated chamber, MITS Pro |
| Temperature | 25 °C in the HPS integrated chamber (MITS Pro test setting TestStg_25C) |
| SOC | 90% (single pulse set) |
| Charge | CC 0.5C to 4.20 V, then CV at 4.20 V until the current falls to 0.01C (datasheet standard charge) |
| SOC adjustment | Discharge 10% of nominal capacity (0.335 Ah) at 0.5C |
| HPPC discharge pulse | 2.50 A (0.75C), 10 s |
| HPPC regen pulse | 1.88 A (0.75 × 2.50 A), 10 s |
| Safety limits | Vmin = 2.50 V, Vmax = 4.20 V, discharge ≤ 3C, charge ≤ 1C, cell temperature within datasheet range |
6.1Test Procedure at 90% SOC and 25 °C
6.2MITS Pro Schedule Implementation
Figure 5 shows the schedule in MITS Pro, programmed as one step per line (sequential method). Table 7 lists the control, step limits and log limits of each step. Capacity-based limits refer to MV_NominalCapacity, the nominal capacity in the MITS Pro cell definition (3.35 Ah), which allows the schedule to be reused for other cells. The CV step holds 1 × LS_CHAN_Voltage, the voltage at the end of the CC step (4.20 V). Charge current is positive and discharge current is negative.
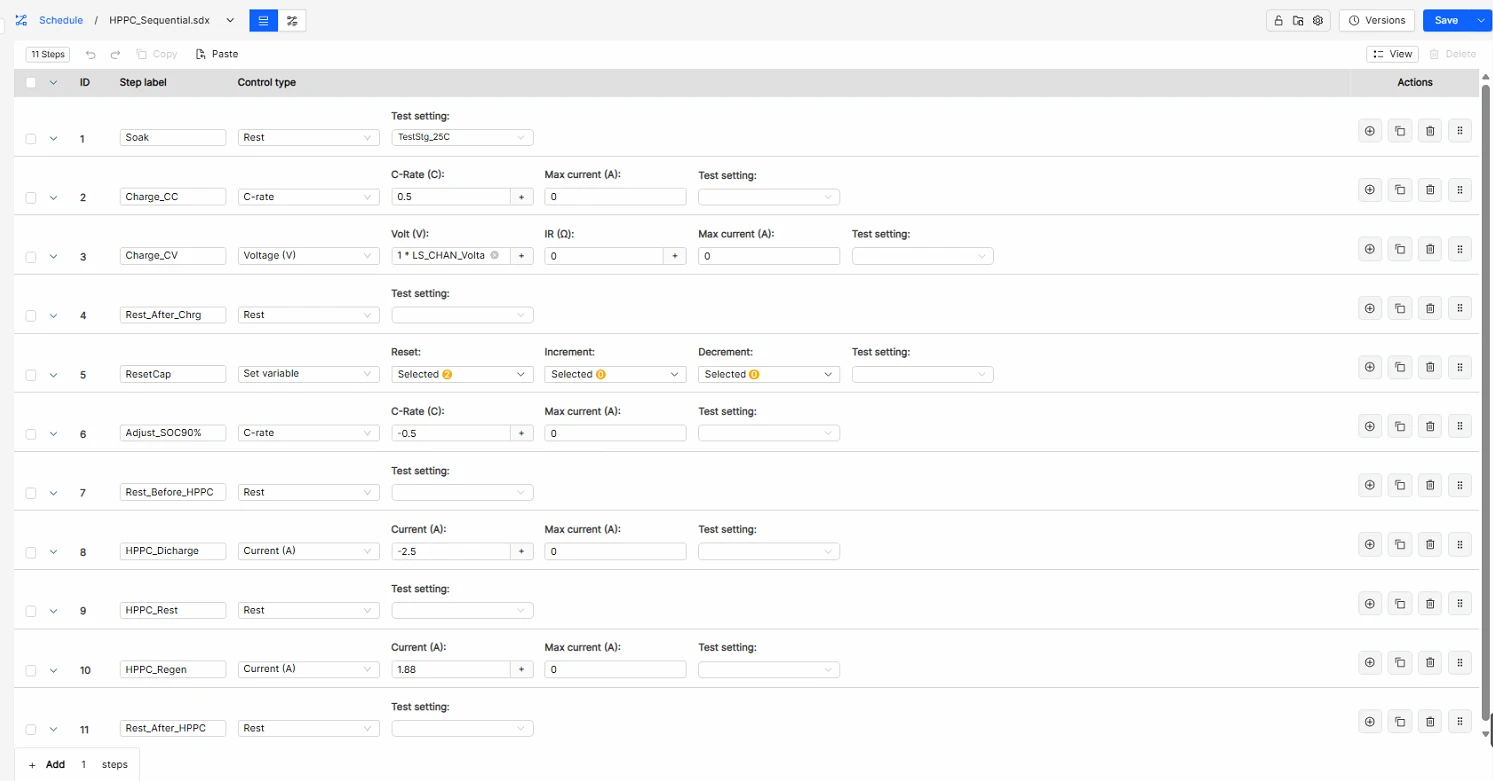
Table 7. HPPC schedule steps and limits
| # | Step label | Control type | Control value | Step limit (goto) | Log limit |
|---|---|---|---|---|---|
| 1 | Soak | Rest | Test setting TestStg_25C | PV_CHAN_Step_Time ≥ 1 h → next | DV_Time ≥ 60 s |
| 2 | Charge_CC | C-rate | +0.5C | PV_CHAN_Voltage ≥ 4.20 V → next | DV_Time ≥ 30 s; DV_Voltage ≥ 0.01 V |
| 3 | Charge_CV | Voltage(V) | 1 × LS_CHAN_Voltage (4.20 V) | PV_CHAN_Current ≤ 0.01 × MV_NominalCapacity → next | DV_Time ≥ 30 s |
| 4 | Rest_After_Chrg | Rest | - | PV_CHAN_Step_Time ≥ 1 h → next | DV_Time ≥ 10 s |
| 5 | ResetCap | Set variable | Reset capacity counters | PV_CHAN_Step_Time ≥ 0 → next | - |
| 6 | Adjust_SOC90% | C-rate | −0.5C | PV_CHAN_Discharge_Capacity ≥ 0.1 × MV_NominalCapacity → next PV_CHAN_Voltage ≤ 2.50 V → end |
DV_Time ≥ 10 s; DV_Voltage ≥ 0.01 V |
| 7 | Rest_Before_HPPC | Rest | - | PV_CHAN_Step_Time ≥ 1 h → next | DV_Time ≥ 10 s |
| 8 | HPPC_Discharge | Current(A) | −2.50 A | PV_CHAN_Step_Time ≥ 10 s → next PV_CHAN_Voltage ≤ 2.50 V → end |
DV_Time ≥ 0.1 s; DV_Voltage ≥ 0.005 V |
| 9 | HPPC_Rest | Rest | - | PV_CHAN_Step_Time ≥ 40 s → next | DV_Time ≥ 0.1 s |
| 10 | HPPC_Regen | Current(A) | +1.88 A | PV_CHAN_Step_Time ≥ 10 s → next PV_CHAN_Voltage ≥ 4.20 V → end |
DV_Time ≥ 0.1 s; DV_Voltage ≥ 0.005 V |
| 11 | Rest_After_HPPC | Rest | - | PV_CHAN_Step_Time ≥ 1 h → end | DV_Time ≥ 10 s |
7Results
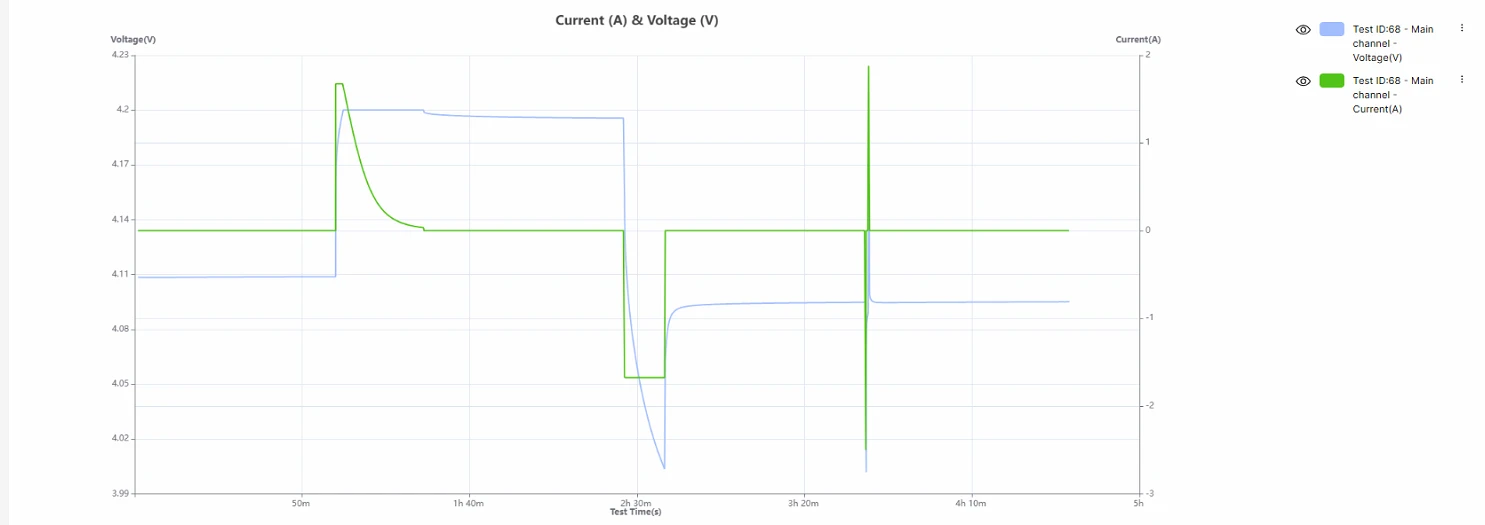
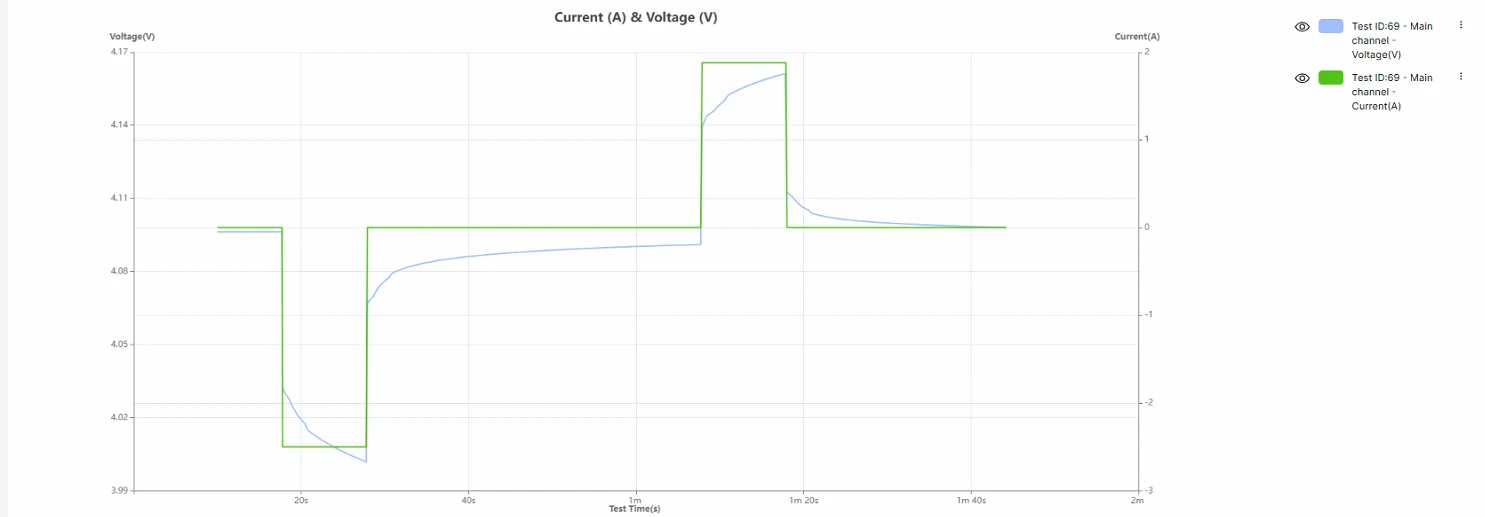
Figure 6 shows the complete test recorded in MITS Pro: soak, CC-CV charge to 4.20 V, rest, 0.5C discharge to 90% SOC, rest, HPPC pulse sequence and final rest. Figure 7 shows the pulse sequence in detail.
The recorded data show the following:
- Pulse current. The current steps to −2.50 A and +1.88 A and remains constant for the full 10 s, so that the resistance is calculated against a defined current.
- Transitions. Discharge, rest and charge follow each other within one minute without visible overshoot or dead time, as provided by bipolar circuitry.
- Data logging. Time- and voltage-based logging records the voltage step at the start of each pulse, the response during the pulse and the subsequent relaxation, while the long rest periods are logged at a lower rate.
- Voltage limits. The voltage remained between 2.50 V and 4.20 V throughout the test, with step limits programmed to end the test if either limit was reached.
Vt0 to Vt3 are taken from the data file, and the resistance and pulse power at this SOC are calculated with Equations (1) to (4).
8Conclusion
HPPC is a short protocol consisting of a 10 s discharge pulse, a 40 s rest and a 10 s charge pulse, repeated across the SOC range. It characterises the power delivery and acceptance of a battery, which capacity testing does not.
Since the results are derived from small voltage changes measured during fast current steps, the quality of HPPC results depends largely on the cycler. Accurate voltage and current measurement, suitable current ranges, fast current steps, flexible data logging, bipolar operation, step-level limit handling and integrated temperature control allow small differences between cells, and small changes as a cell ages, to be measured reproducibly.
A precision cycler with these characteristics improves the reliability and comparability of HPPC results. In MITS Pro, the protocol is programmed once as a schedule, uses the cell definition for capacity-based limits, and applies the appropriate logging and limits to each step.
References
- [1]FreedomCAR Battery Test Manual for Power-Assist Hybrid Electric Vehicles, DOE/ID-11069, Idaho National Engineering and Environmental Laboratory, October 2003.
- [2]Battery Test Manual for Electric Vehicles, Revision 3, INL/EXT-15-34184, Idaho National Laboratory, June 2015.
- [3]R. Rogers, "HPPC Test with Arbin," Arbin Instruments, 2021.
- [4]W. Waag, S. Käbitz, D. U. Sauer, "Experimental investigation of the lithium-ion battery impedance characteristic at various conditions and aging states and its influence on the application," Applied Energy, 102, 885-897 (2013).
- [5]H. He, R. Xiong, J. Fan, "Evaluation of lithium-ion battery equivalent circuit models for state of charge estimation by an experimental approach," Energies, 4, 582-598 (2011).
- [6]G. L. Plett, Battery Management Systems, Volume I: Battery Modeling, Artech House, 2015.
- [7]A. Barai, K. Uddin, W. D. Widanage, A. McGordon, P. Jennings, "A study of the influence of measurement timescale on internal resistance characterisation methodologies for lithium-ion cells," Scientific Reports, 8, 21 (2018).
- [8]energy inside GmbH, "Specification for Lithium-Ion Rechargeable Cell XCell N18650-35E," document 148187. Datasheet (PDF)
- [9]Arbin Instruments, "HPS Ultra-High Precision Battery Cycler," arbin.com/battery-research/high-precision-tester.html
System used in this note
HPS Ultra-High Precision Battery Cycler
±6 V bipolar, six current ranges from 5 A to 100 µA, 10 ppm voltage precision, and an integrated chamber per channel from 10 to 60 °C.
Running HPPC on modules or packs?
Send us your test plan. An applications engineer will recommend the system and set up the HPPC schedule with you.
Related application notes
Other resistance and pulse methods on Arbin systems.
How to perform DC Internal Resistance measurement with Arbin?
How MITS measures DC internal resistance with the pulse method.
Read note →Internal Resistance measurement according to IEC 61960
The IEC 61960 two-step discharge pulse method.
Read note →Battery Test for Electric Vehicles (EV)
EV procedures including cold cranking, programmed in MITS.
Read note →What is a Pulse step?
Pulse-level and stage-level settings for short, high-rate steps.
Read FAQ →