 English
  简体中文
简体中文  한국어
한국어 



Battery Cell Grading and Matching: Why Measurement Precision Determines Pack Performance
Summary
A battery pack is only as good as its weakest cell. In a series string, charging stops when the first cell reaches its upper voltage limit and discharging stops when the first cell reaches its lower limit. Any spread in capacity, resistance or self-discharge between cells therefore reduces the usable energy of the whole pack, and that spread tends to grow as the pack ages.
Cell grading is the process of measuring every cell against defined parameters and sorting it into a grade or bin. Cell matching is the process of assembling cells from the same bin into modules and packs. Done well, grading removes defective cells before they reach a pack and ensures the cells in each pack age together.
This paper explains where grading fits in the cell lifecycle, which parameters matter, why measurement precision sets the limit on how finely cells can be graded, and how life cycle testing is used to validate grading criteria. It closes with an experimental study in which eight new commercial cells were equalized, charged and discharged in parallel on Arbin's Parallel Differential Battery Tester (PDBT), and their capacities compared.
1Why Cell-to-Cell Variation Matters
No two cells are identical. Small differences in electrode coating thickness, material loading, electrolyte fill and formation conditions produce measurable differences in capacity, internal resistance and self-discharge, even between cells from the same production lot. In a study of 1,100 commercial cells, Rumpf et al. measured relative variations of about 0.28% in capacity and 0.72% in impedance [1].
These differences are small in fresh cells, but they matter for three reasons:
- The weakest cell limits the string. Because all cells in a series string carry the same current, the lowest-capacity cell determines when charge and discharge must stop. Energy stored in the stronger cells cannot be fully used [2].
- Variation grows with age. Initial differences in resistance and self-discharge cause cells to operate at slightly different states of charge and temperatures, which leads to different degradation rates. Studies of production variation and of cells in electric vehicle packs show that the spread in capacity widens over the service life [3][4].
- Some defects are invisible to a capacity test. A cell with a developing internal micro-short can deliver full rated capacity on day one while losing charge faster than its neighbours. Only a self-discharge measurement reveals it, and such cells are both a performance and a safety risk [5].
The consequences also depend on how cells are connected. In series strings, capacity and self-discharge mismatch cause state-of-charge drift that the battery management system must correct by balancing. In parallel groups, resistance mismatch causes current to divide unevenly, so the lower-resistance cells carry more current, run hotter and age faster [6].
2Where Grading Fits in the Cell Lifecycle
Grading is performed on every cell, typically at the end of cell production and again at incoming inspection by the pack assembler. It is not performed after life cycle testing on the same cells. Life cycle testing is a long, destructive test carried out on a statistical sample of cells; the cells it ages are not used in products. Its role in grading is different and equally important: it validates whether the grading criteria actually predict how cells will age.
Table 1. Where grading and life cycle testing are used
| Stage | Purpose | Cells tested | Typical measurements |
|---|---|---|---|
| Formation and end-of-line grading (cell maker) | Screen defects and assign every cell to a grade | Every cell | Capacity, OCV, ACIR or DCIR, self-discharge (OCV decay) |
| Incoming inspection (pack maker) | Verify supplier grades and match cells into modules | Every cell or a sample | OCV, ACIR, capacity, OCV decay |
| Life cycle and qualification testing | Validate that grading criteria predict ageing; set bin limits | Statistical sample | Capacity and resistance tracked over hundreds to thousands of cycles |
| Second-life grading | Re-grade retired cells or modules for a new application | Every retired cell or module | State of health (capacity), resistance, self-discharge, incremental capacity analysis |
Second-life grading is the one case in which cells are graded after ageing. Cells retired from electric vehicles vary much more widely than fresh cells, so grading them accurately is what makes reuse in stationary storage viable [7].
3Grading Parameters
Capacity alone is not sufficient. A robust grading scheme combines several parameters, each of which reveals a different aspect of cell quality.
Table 2. Common grading parameters
| Parameter | How it is measured | What it reveals |
|---|---|---|
| Discharge capacity (Ah) and energy (Wh) | Full CC-CV charge followed by constant-current discharge at a defined rate and temperature | Usable charge; sets the string capacity in series configurations |
| DC internal resistance (DCIR) | Voltage response to a current pulse of defined amplitude and duration at a defined state of charge | Power capability and heat generation; current sharing in parallel groups |
| AC internal resistance (ACIR) | Impedance at a single frequency, typically 1 kHz | Fast screening of ohmic resistance; does not capture charge-transfer or diffusion effects |
| Open-circuit voltage (OCV) | Rested terminal voltage under controlled temperature | State-of-charge consistency before assembly |
| Self-discharge rate (K-value) | Change in OCV over a controlled storage period | Internal micro-shorts, incomplete SEI formation, contamination |
| Coulombic efficiency | Ratio of discharge to charge capacity | Side reactions and parasitic losses; an early indicator of ageing |
The self-discharge rate is usually expressed as a K-value, the rate of OCV decay during a rest period:
where OCV1 and OCV2 are rested open-circuit voltages measured at the start and end of a storage period Δt, at the same controlled temperature. Research on parallel-connected cells has shown that variation in self-discharge rate has a strong effect on cycle life, which is why many manufacturers now treat it as a primary sorting parameter rather than a secondary check [8].
4Why Measurement Precision Sets the Limit
Grading can only separate cells whose differences are larger than the uncertainty of the measurement. If manufacturing variation in capacity is a few tenths of a percent, the test system must measure capacity with an uncertainty well below that, or cells will be assigned to bins at random.
A common rule in metrology is that the measurement uncertainty should be no more than a quarter of the tolerance being checked. For a capacity bin 0.5% wide, that means a capacity measurement uncertainty of about 0.1%, which in turn depends on the accuracy and stability of the current source and on the timing of the test.
Self-discharge screening is even more demanding. The OCV differences that distinguish a normal cell from a defective one over a few days can be a fraction of a millivolt, while a temperature change of one degree can shift OCV by a similar amount. Reliable K-value grading therefore requires:
- Voltage measurement with resolution and long-term stability at the level of tens of microvolts.
- Temperature control during rest periods, so that thermal effects do not mask self-discharge.
- Consistent rest times before each OCV reading, because voltage relaxation after charge continues for hours.
- Consistent conditions across channels, so that differences between cells are not differences between test channels.
As an example, the PDBT used in the study below specifies an accuracy of ± 0.02% of full-scale range. Full-scale range here means the total span of a range, so on the ± 5 A range (10 A span) the accuracy is ± 2 mA, or ± 0.30% of a 0.67 A discharge current, which supports capacity bins down to about 1.2% wide under the quarter-tolerance rule. On the ± 1 A range (2 A span) the same specification gives ± 0.4 mA, or ± 0.06% of 0.67 A, which supports bins of about 0.25%, close to the level of typical production variation. Selecting the smallest current range that covers the test current is therefore as important as the accuracy specification itself.
PDBT accuracy ±0.02% of full-scale range, quarter-tolerance rule.
5The Grading and Matching Process
A typical grading workflow has five steps. The order matters: cells must be brought to the same condition before they are compared, and outliers must be removed before bins are defined.
Table 3. Grading and matching workflow
| Step | What happens | Why it matters |
|---|---|---|
| 1. Condition | Bring all cells to the same temperature and state of charge, with a defined rest time | Makes measurements comparable |
| 2. Measure | Capacity, resistance, OCV and OCV decay under identical protocols | Produces the data every later decision depends on |
| 3. Screen | Reject cells outside specification limits or statistical outliers, especially high self-discharge | Removes defective and potentially unsafe cells |
| 4. Bin | Assign remaining cells to grades by one or more parameters | Groups cells that will behave alike |
| 5. Match and verify | Assemble modules from a single bin; verify at module level | Confirms the matching achieved its purpose |
5.1Binning methods
- Fixed tolerance bins, for example capacity in 0.5% steps. Simple and transparent, but they ignore correlations between parameters.
- Statistical bins, based on the mean and standard deviation of each production lot. They adapt to lot-to-lot shifts and support process-capability reporting.
- Multi-parameter clustering, which groups cells by their combined capacity, resistance and self-discharge profile. This is increasingly used for second-life cells, where parameters are less correlated.
Not every bin is a reject. Cells outside the tightest grade are often suitable for less demanding applications, so grading also determines where each cell can be used.
6Validating Grading with Life Cycle Testing
Grading criteria are only useful if they predict long-term behaviour. Life cycle testing answers that question directly: cells from different bins, or strings of matched and unmatched cells, are cycled under controlled conditions and their capacity and resistance are tracked. Baumhöfer et al. showed that initial cell performance correlates with later ageing trends [3], which is what makes grading meaningful.
Life cycle testing supports grading in three ways:
- It shows which parameters best predict capacity fade for a given cell design, so grading effort can focus on them.
- It sets defensible bin widths, by showing how much initial variation a pack can tolerate before its life is affected.
- It quantifies the benefit of matching, which justifies the cost of the grading step itself.
The experimental study below covers the first half of this approach: measuring and grading a set of cells. Cycling the graded cells to test whether the grades predict ageing is the planned next step.
7Experimental Study: Grading Eight Cells in Parallel
The study below applies the grading principles described above to eight new commercial cells, using Arbin's Parallel Differential Battery Tester (PDBT). It measures how closely the cells can be equalized, how their capacities and resistances are distributed, and whether the parallel measurement agrees with a conventional single-channel test.
7.1The Parallel Differential Battery Tester
A conventional cycler applies the same programmed current to each cell through its own channel. The PDBT instead connects up to eight cells physically in parallel while measuring the voltage and current of each cell individually. All cells therefore see essentially the same terminal voltage, and the total current divides among them according to their individual behaviour. Differences between cells appear directly as differences in current, which is the signal a grading process needs.
Before cells can be paralleled, their voltages must be brought close together. The PDBT does this automatically with a pre-conditioning step (PreCCCV), which charges or discharges each cell to a common target voltage and then holds it there.
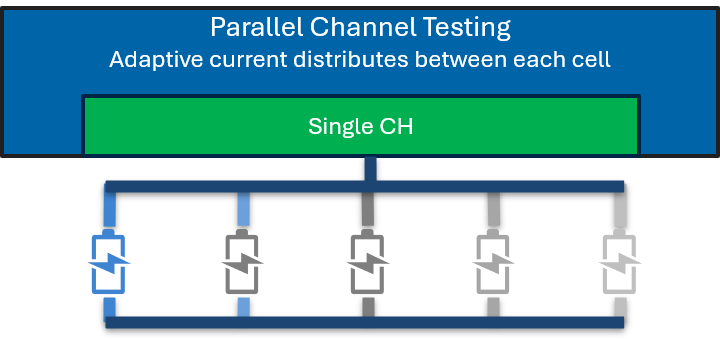

Table 4. PDBT specifications relevant to this study (from the PDBT brochure [9])
| Parameter | Specification |
|---|---|
| Sub-channels | 8 cells in parallel, each with individual voltage and current measurement |
| Voltage range | 0 to 5 V |
| Current ranges | ± 5 A / ± 1 A / ± 10 mA / ± 1 mA per sub-channel; up to 40 A in parallel |
| Accuracy / precision | ± 0.02% / ± 0.015% of full-scale range (FSR = total span of the range, e.g. 10 A for the ± 5 A range; for voltage, FSR is 10 V (−5 to +5 V) although the operating range is 0 to 5 V) |
| Resolution | 24-bit measurement, 16-bit control |
| Temperature chamber | One zone, 8 cell fixtures; control stability ± 0.5 °C, uniformity ± 1.5 °C |
7.2Cells and setup
Eight brand-new, identical XCell N18650CP-35E cylindrical cells were used (nominal capacity 3,350 mAh, nominal voltage 3.6 V, datasheet internal resistance below 35 mΩ). The cells were numbered 1 to 8 and each was placed in the tray position with the same number. The PDBT (0 to 5 V, ± 5 A, 8 sub-channels, integrated PT100 temperature sensing) was operated with MITS 10.5.2.5 and the chamber set to 25 °C.
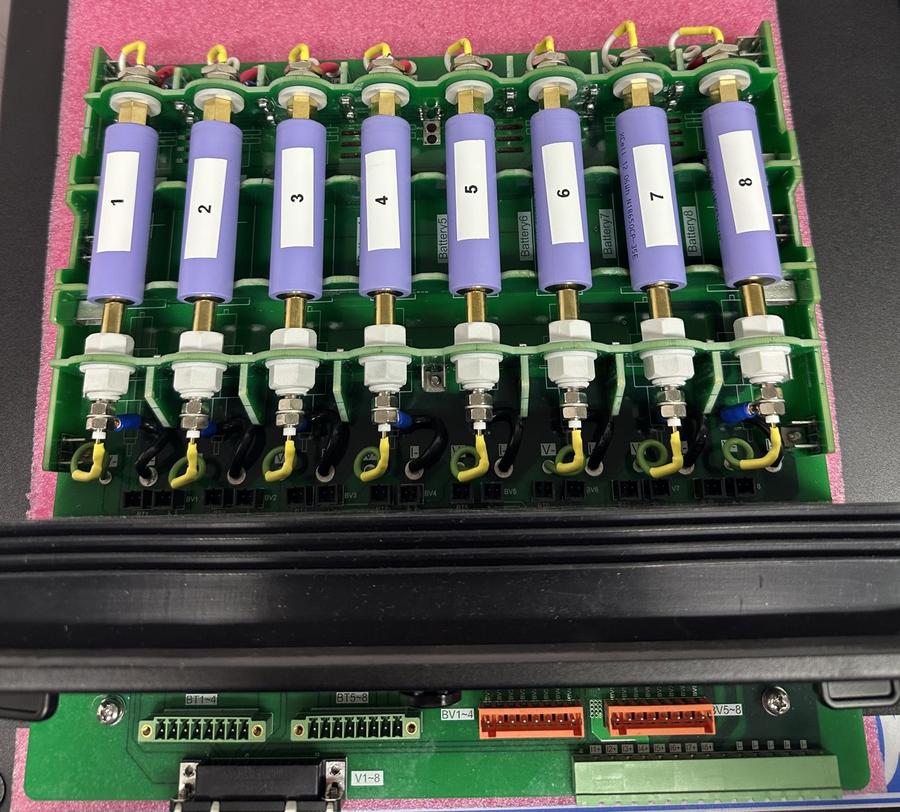
7.3Test protocol
Table 5. Test protocol (C = 3,350 mA; all currents per cell)
| Step | Mode | Conditions and end condition |
|---|---|---|
| 1. Temperature stabilisation | Rest, cells separated | Chamber at 25 °C; until cell temperature 24.5 to 25.5 °C |
| 2. Internal resistance | Pulse, cells separated | 0.1 A amplitude, 20 ms pulse |
| 3. Equalization (PreCCCV) | Individual, then parallel | 0.5C to 3.6 V, then CV hold for 30 min |
| 4. Rest | Parallel | 10 min |
| 5. Rest | Separated | 2 min |
| 6. Full charge | CC-CV, parallel | 0.5C to 4.2 V; until the largest cell current falls below 0.01C (33.5 mA) |
| 7. Relaxation | Rest | 5 min |
| 8. Full discharge | Constant current, parallel | 0.2C (0.67 A per cell, 5.36 A total); until the highest individual cell voltage falls to 2.5 V |
Two details of the protocol are essential for a valid grading measurement, and both were learned in earlier runs. First, the discharge end condition must use the individual cell voltages, not the voltage of the common main channel: with current flowing, the main-channel voltage read about 80 mV below the cell voltages, and an earlier run terminated on it left every cell about 80 mV above the intended cut-off, under-reporting capacity. Second, cells must be equalized before they are paralleled. When cells charged to 4.2 V, 3.5 V and 2.5 V were paralleled without pre-conditioning, the equalizing current between them exceeded the 5 A sub-channel limit and the test stopped on a safety alarm.
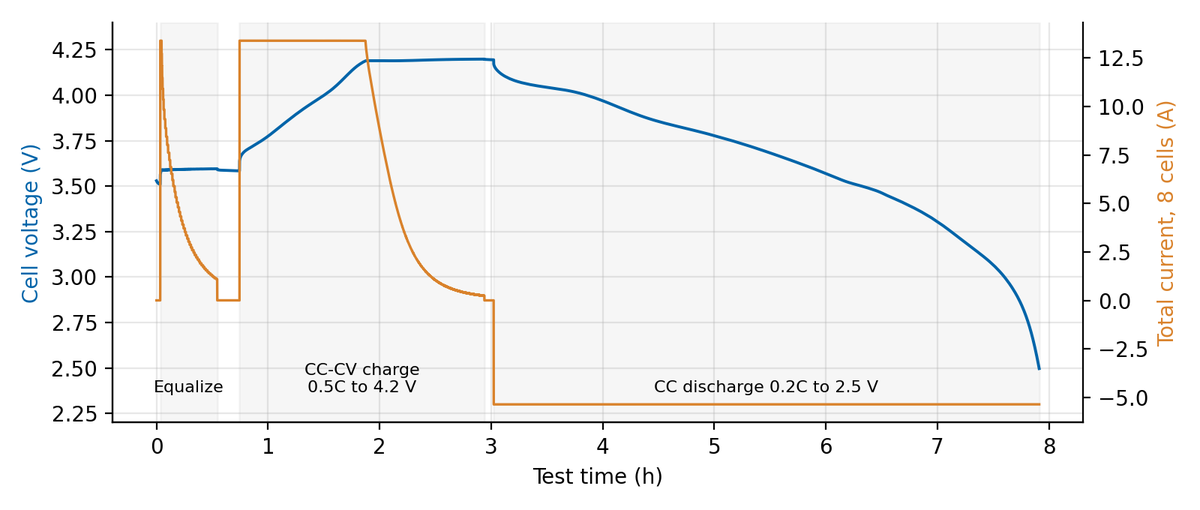
7.4Results
Equalization
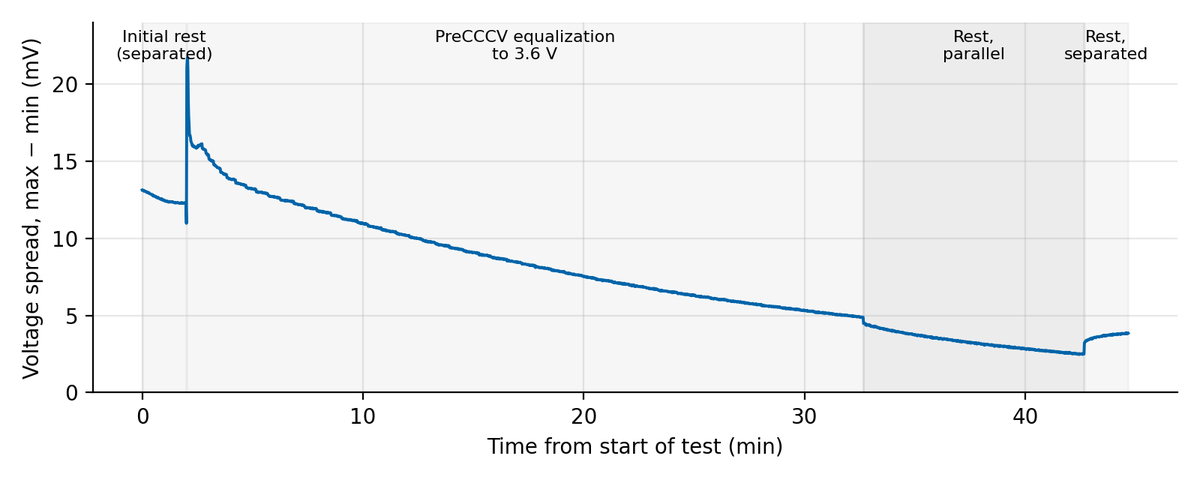
At the start of the test, the open-circuit voltages of the eight cells spanned 12.3 mV (3.505 to 3.518 V). Equalization reduced this spread steadily: to 4.9 mV at the end of the 30-minute PreCCCV step and to 2.5 mV after 10 minutes of rest in parallel. When the cells were separated again, the spread relaxed to 3.9 mV within two minutes, as each cell returned towards its own open-circuit voltage. Equalization was still progressing when the step ended, so a longer hold would reduce the spread further.
The voltage accuracy of each sub-channel is ± 2 mV (0.02% of the 10 V full-scale span; the operating range is 0 to 5 V, but accuracy is specified over −5 to +5 V), so two channels reading the same voltage can differ by up to 4 mV. A spread of 2 to 4 mV is therefore within measurement capability, and the cells can be considered equalized. During parallel operation under load, the individual voltage readings differed by about 9 mV, which most likely reflects differences in the resistance of each cell's connection path rather than differences in the cells themselves. This matters for grading: 9 mV at 0.67 A corresponds to a path-resistance difference of roughly 13 mΩ, about half the internal resistance of the cells, which is enough to influence how the total current divides among them. The position-rotation test described under Interpretation for grading is designed to separate this fixture effect from genuine cell differences.
Capacity, energy and resistance
Table 6. Results per cell
| Cell | Initial OCV (V) | IR (mΩ) | Discharge capacity (mAh) | % of nominal | Discharge energy (Wh) | Mean current (A) | Mean temp. (°C) |
|---|---|---|---|---|---|---|---|
| 1 | 3.5069 | 26.8 | 3,269 | 97.59 | 11.85 | 0.6685 | 25.4 |
| 2 | 3.5075 | 27.6 | 3,264 | 97.42 | 11.83 | 0.6674 | 25.4 |
| 3 | 3.5075 | 26.5 | 3,276 | 97.80 | 11.88 | 0.6699 | 25.5 |
| 4 | 3.5123 | 26.1 | 3,275 | 97.75 | 11.87 | 0.6696 | 25.6 |
| 5 | 3.5054 | 26.7 | 3,263 | 97.40 | 11.83 | 0.6672 | 25.7 |
| 6 | 3.5075 | 27.3 | 3,274 | 97.72 | 11.86 | 0.6694 | 25.7 |
| 7 | 3.5177 | 26.3 | 3,293 | 98.31 | 11.94 | 0.6734 | 25.7 |
| 8 | 3.5099 | 26.1 | 3,310 | 98.80 | 12.01 | 0.6768 | 25.8 |
| Mean ± 1σ | 3.5093 ± 0.0040 | 26.7 ± 0.5 | 3,278 ± 16 | 97.85 ± 0.48 | 11.88 ± 0.06 | 0.6703 ± 0.0033 | 25.6 |
The discharge capacities ranged from 3,263 to 3,310 mAh, a spread of 47 mAh or 1.4% of the mean, with a standard deviation of 16 mAh (0.49%). This is of the same order as the 0.28% capacity variation reported for a large population of commercial cells [1]. All cells delivered between 97.4% and 98.8% of their nominal capacity.
Because all cells in the parallel group discharge for exactly the same time, each cell's capacity is its mean current multiplied by the common discharge time, so the capacity differences are, by construction, differences in how the total current divided among the cells. A cell's share of the current depends on its capacity, its internal resistance, the shape of its voltage curve and the resistance of its connection path. The parallel method therefore measures how each cell performs relative to the others at a shared voltage, which is the quantity that matters for matching, rather than a fully independent absolute capacity.
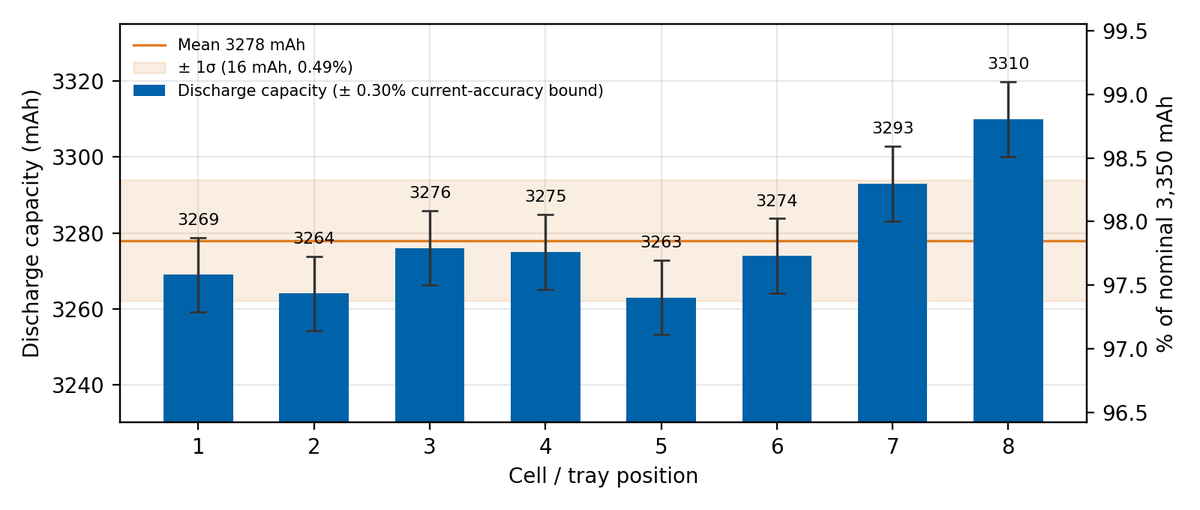
Can these differences be resolved? The current accuracy of ± 0.02% of full scale corresponds to ± 2 mA on the ± 5 A range (10 A span), or ± 0.30% of the 0.67 A discharge current. The measured capacity spread (1.4%) is about five times this bound, so cell 8 is reliably distinguished from all other cells, and cell 7 from the lowest ones. Cells 1 to 6, however, lie within 13 mAh (0.4%) of each other, which is within the combined bound of two channels, so they cannot be distinguished from one another by this measurement. Because the accuracy bound is largely systematic for each channel, rotating cells between positions would reduce its effect, and running the discharge on the ± 1 A range would tighten it to about ± 0.06%.
Internal resistance measured 26.1 to 27.6 mΩ, all within the datasheet limit of 35 mΩ. The 20 ms, 0.1 A pulse produces a voltage change of only about 3 mV. Because resistance is calculated from a voltage difference, fixed offset errors largely cancel, but at this signal level noise and resolution limit the precision, and a pulse this short mainly captures ohmic and contact resistance. The result is therefore suitable as a pass/fail screen but not for ranking cells. A larger and longer pulse would be needed to use resistance as a grading parameter.
Current sharing during discharge
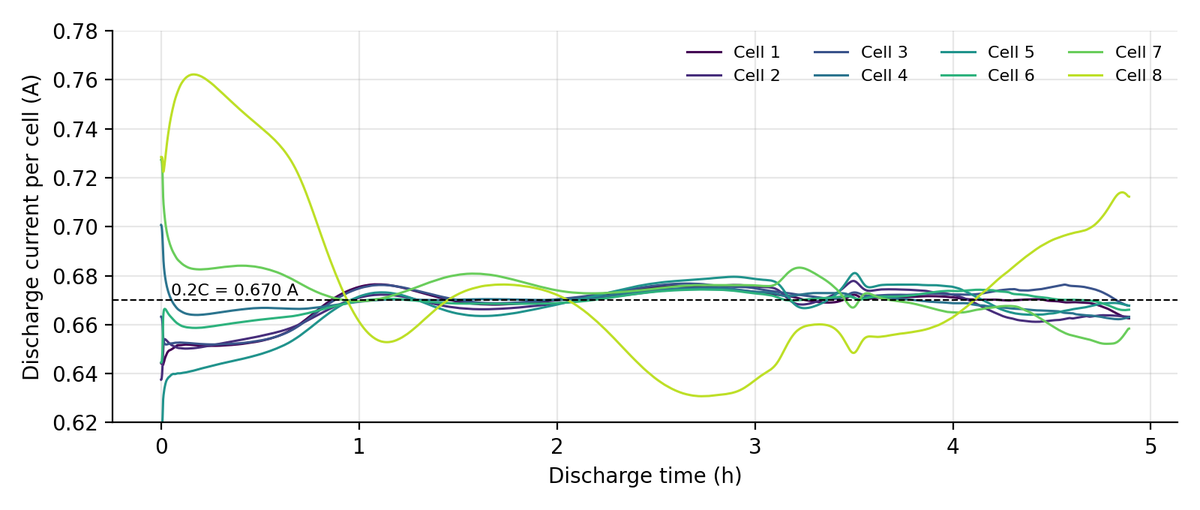
Figure 6 shows how the 5.36 A total discharge current divided among the cells. Seven cells stayed within about ± 2% of the nominal 0.67 A for most of the discharge. Cell 8 behaved differently: it carried up to 0.76 A (14% above nominal) in the first hour and less than nominal between two and three hours, before rising again near the end.
This is the differential signal the parallel method provides. A capacity difference of 1% becomes a current deviation of more than 10% at particular states of charge, because a cell whose voltage curve differs slightly from its neighbours must supply more or less current to stay at the common voltage. The current profile therefore flags cell 8 as different from the group much more clearly than its end-of-test capacity does.
Comparison with a conventional cycler
To check the parallel measurement against conventional testing, cell 5 was also discharged on an Arbin LBT (0 to 5 V, ± 5 A, 8 channels).
Table 7. Cell 5 on the PDBT and on the LBT
| PDBT (in parallel) | LBT (single channel) | Difference | |
|---|---|---|---|
| Discharge capacity, % of nominal | 97.40% | 97.67% | 0.27 percentage points |
| Full discharge duration | 4 h 52 min 59 s | 4 h 53 min 25 s | 26 s (0.15%) |
The two instruments agree to within 0.27 percentage points (about 9 mAh), which is within the combined uncertainty of the two instruments (about ± 0.3% each). The LBT also measured cell 5 below its nominal capacity, which indicates that capacities below 100% reflect the cells themselves rather than the parallel method. This comparison covers one cell and one repetition; the difference is about half the cell-to-cell standard deviation, so further repeat measurements are needed before the agreement can be stated more tightly.
7.5Interpretation for grading
On capacity, cells 1 to 6 lie within 0.4% of each other and would share a grade under any practical bin width. Cell 8 lies 1.0% above the mean, well outside the measurement bound, and also shows a distinctly different current profile. Cell 7 lies 0.5% above the mean and is a borderline case: it is separated from the lowest cells but not clearly from the rest of the group.
One result must be interpreted with care. Capacity increases with tray position (correlation coefficient 0.75), and so does cell temperature, which rose from 25.4 °C at position 1 to 25.8 °C at position 8. A temperature difference of 0.4 °C is too small to explain a 1% capacity difference on its own, but a systematic effect of position, from either temperature or the connection path, cannot be excluded from a single arrangement. The 9 mV differences in cell voltage observed under load make the connection path a plausible cause. The cells should therefore be re-tested with their positions rotated before the capacity differences are attributed to the cells. If cells 7 and 8 remain highest wherever they sit, the difference belongs to the cells; if the high values follow positions 7 and 8, it belongs to the fixture.
7.6Next steps
- Sample size. Eight cells are enough to demonstrate the method but not to set bin limits. Statistical grading requires a larger population from one production lot.
- Repeatability. Each result comes from a single charge-discharge cycle. Repeat cycles, and the position-rotation test described above, are needed to separate cell differences from measurement and fixture effects.
- Current range. The discharge was measured on the ± 5 A range. Repeating it on the ± 1 A range, which covers the 0.67 A discharge current and the 0.76 A peak of cell 8, would reduce the current accuracy bound from ± 0.30% to about ± 0.06%.
- Reference measurement. Only cell 5 was cross-checked on a conventional cycler. Measuring all eight cells individually would confirm that the ranking obtained in parallel matches the ranking of their individual capacities.
- Self-discharge. Self-discharge, the most important screening parameter for hidden defects, was not measured in this study. The PDBT supports self-discharge current measurement in parallel, and this is the next planned experiment.
- Ageing. Whether the grades predict how the cells age can only be shown by cycling. A follow-up study will cycle matched and unmatched groups and track their divergence.
8How Arbin Supports Cell Grading
Arbin test systems support each stage of the grading and validation process described in this paper:
- Parallel differential testing with the PDBT, which equalizes cells automatically, holds them at a common voltage, and measures each cell's current individually, so that differences between cells appear directly and simultaneously.
- High-precision measurement, with 24-bit resolution and ± 0.02% full-scale accuracy on the PDBT. On the ± 1 A range this corresponds to about ± 0.06% of the discharge current used in this study, fine enough to grade new cells at the level of typical production variation.
- Self-discharge current measurement in parallel, which shortens the screening for high self-discharge compared with waiting for open-circuit voltage to decay.
- Programmable test schedules in MITS, so that equalization, charge, discharge and rest steps run identically for every cell.
- Temperature-controlled testing, with the PDBT's integrated chamber holding cells within ± 0.5 °C of the set point.
- Conventional single-channel cyclers such as the LBT, for cross-checking results and for cycle-life testing of graded cells.
9Conclusion
Cell grading is the step that turns a population of slightly different cells into packs that perform consistently and age evenly. It is performed on every cell after formation and at incoming inspection, while life cycle testing on a sample of cells validates that the grading criteria predict long-term behaviour.
Capacity alone is not enough. Resistance and self-discharge reveal defects and mismatches that a capacity test misses, and the precision of the test equipment sets the limit on how finely cells can be graded.
The PDBT experiment showed that eight new cells of the same product had a measured capacity spread of 1.4%, about five times the instrument's accuracy bound on the ± 5 A range, and that testing them in parallel exposes differences in current that are much larger than the capacity differences themselves. It also showed what a valid parallel grading protocol requires: equalization before paralleling, end conditions based on individual cell voltages, stable temperature, the smallest suitable current range, and repeat tests with rotated positions to separate cell effects from fixture effects.
For more information on Arbin systems for cell grading and life cycle testing, please contact your Arbin sales representative.
References
- [1]K. Rumpf, M. Naumann, A. Jossen, "Experimental investigation of parametric cell-to-cell variation and correlation based on 1100 commercial lithium-ion cells," Journal of Energy Storage, vol. 14, pp. 224-243, 2017.
- [2]D. Beck, P. Dechent, M. Junker, D. U. Sauer, M. Dubarry, "Inhomogeneities and cell-to-cell variations in lithium-ion batteries, a review," Energies, vol. 14, no. 11, 3276, 2021.
- [3]T. Baumhöfer, M. Brühl, S. Rothgang, D. U. Sauer, "Production caused variation in capacity aging trend and correlation to initial cell performance," Journal of Power Sources, vol. 247, pp. 332-338, 2014.
- [4]S. F. Schuster, M. J. Brand, P. Berg, M. Gleissenberger, A. Jossen, "Lithium-ion cell-to-cell variation during battery electric vehicle operation," Journal of Power Sources, vol. 297, pp. 242-251, 2015.
- [5]Keysight Technologies, "Measure self-discharge using OCV on lithium-ion cells," Electronic Design, 2019.
- [6]X. Liu, W. Ai, M. N. Marlow, Y. Patel, B. Wu, "The effect of cell-to-cell variations and thermal gradients on the performance and degradation of lithium-ion battery packs," Applied Energy, vol. 248, pp. 489-499, 2019.
- [7]M. J. Brand, D. Quinger, G. Walder, A. Jossen, M. Lienkamp, "Ageing inhomogeneity of long-term used BEV-batteries and their reusability for 2nd-life applications," EVS26, 2012.
- [8]"Self-discharge rates in cells have a critical effect on the cycle life of parallel lithium-ion batteries," RSC Advances, vol. 8, pp. 30802 ff., 2018.
- [9]Arbin Instruments, "Parallel Differential Battery Testing: PDBT Benchtop Series," product brochure, 2025.
System used in this study
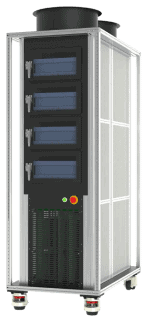
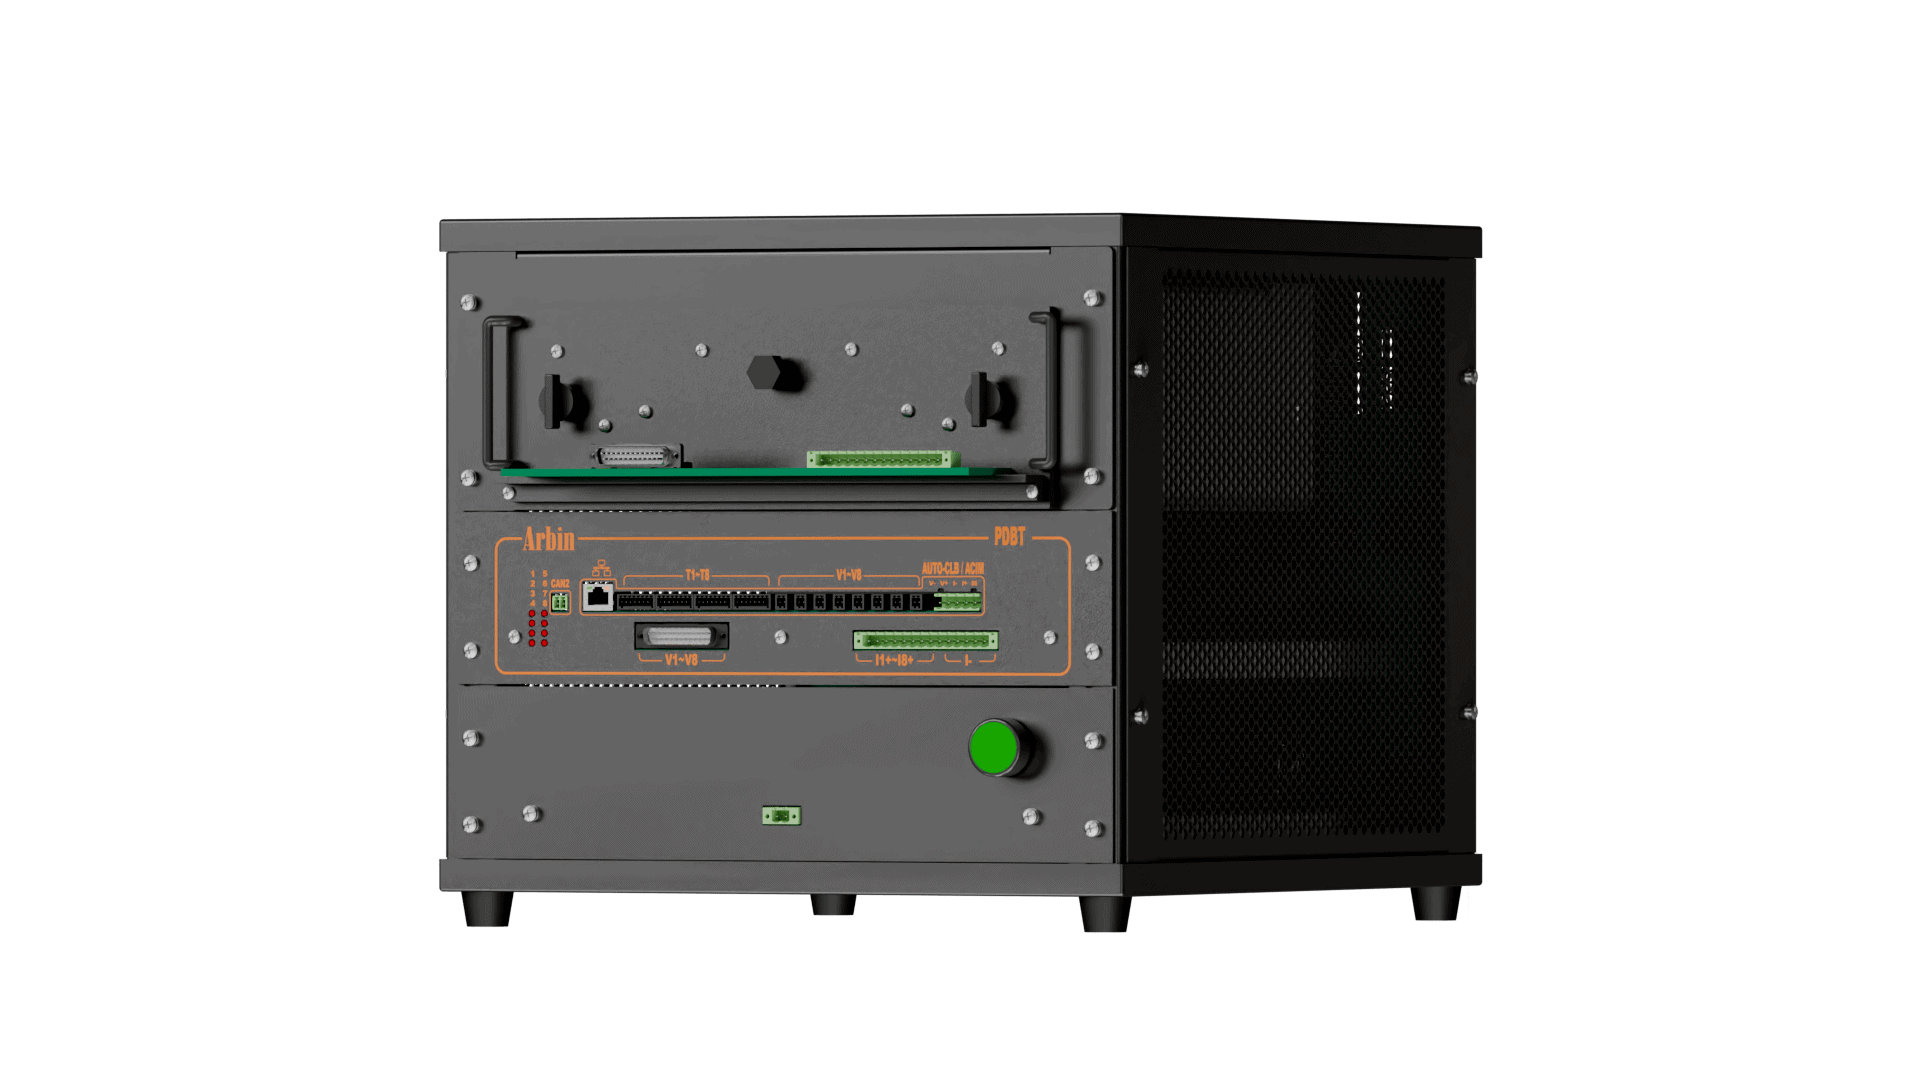
PDBT Parallel Differential Battery Tester
Eight cells in parallel with individual voltage and current measurement, automatic equalization, ±0.02% FSR accuracy, 24-bit measurement and an integrated temperature-controlled chamber.
Setting up cell grading or incoming inspection?
Send us your cell type, volumes and grading parameters. An applications engineer will recommend a system and test protocol.
Related reading
Measurement precision, resistance and self-discharge on Arbin systems.
Accuracy and Precision: Impact of Precision
How tester precision affects what you can resolve between cells and between cycles.
Read note →Accuracy and precision: Overview
The difference between accuracy and precision in battery testing, and why both matter.
Read note →Self Discharge Current Measurement
Measure self-discharge current directly instead of waiting for OCV to decay.
Learn more →HPPC Testing with Arbin MITS Pro
Pulse resistance and pulse power across SOC, with a worked 18650 test.
Read note →