 English
 简体中文
 한국어

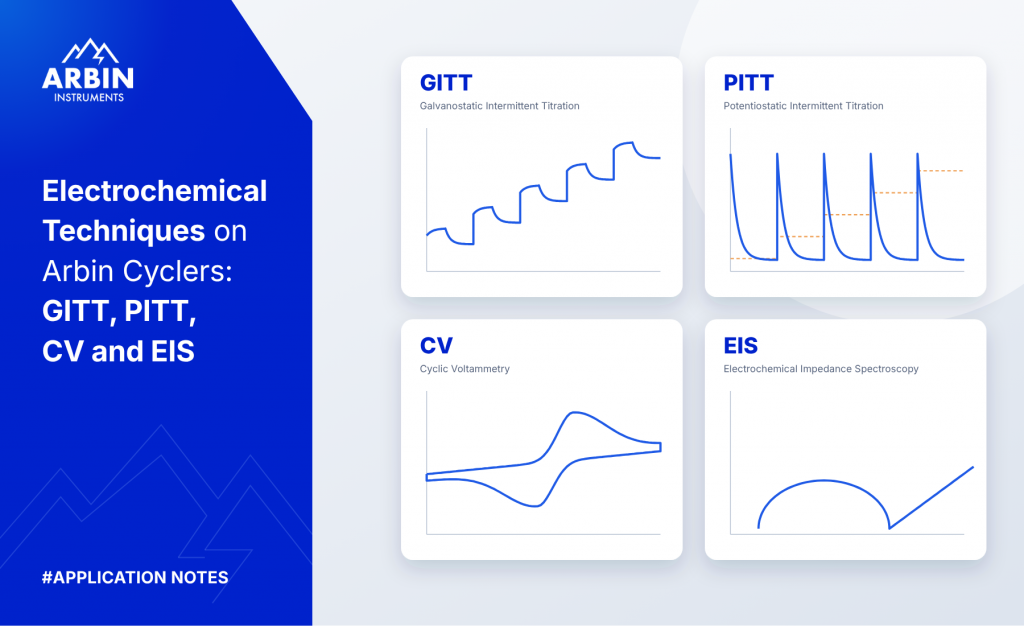
Electrochemical Techniques for Battery Research
Summary
Cycling shows how much capacity a cell has and how fast it fades, but not why. GITT, PITT, cyclic voltammetry and EIS each probe a different part of the answer. This note sets out what each technique applies, measures and reveals, and which cycler specifications decide whether the result is trustworthy.
1Why Electrochemical Techniques
Charge–discharge cycling shows how much capacity a cell has and how fast it fades, but not why. Electrochemical techniques answer that question: they probe how fast ions diffuse, where redox reactions occur, and which resistances limit performance.
Four methods are widely used in battery research: GITT, PITT, cyclic voltammetry (CV) and electrochemical impedance spectroscopy (EIS). This note summarises what each one applies, what it measures and what it reveals, and explains how the cycler itself affects the quality of the results. All four can be run on Arbin cyclers [1].
2GITT: Galvanostatic Intermittent Titration
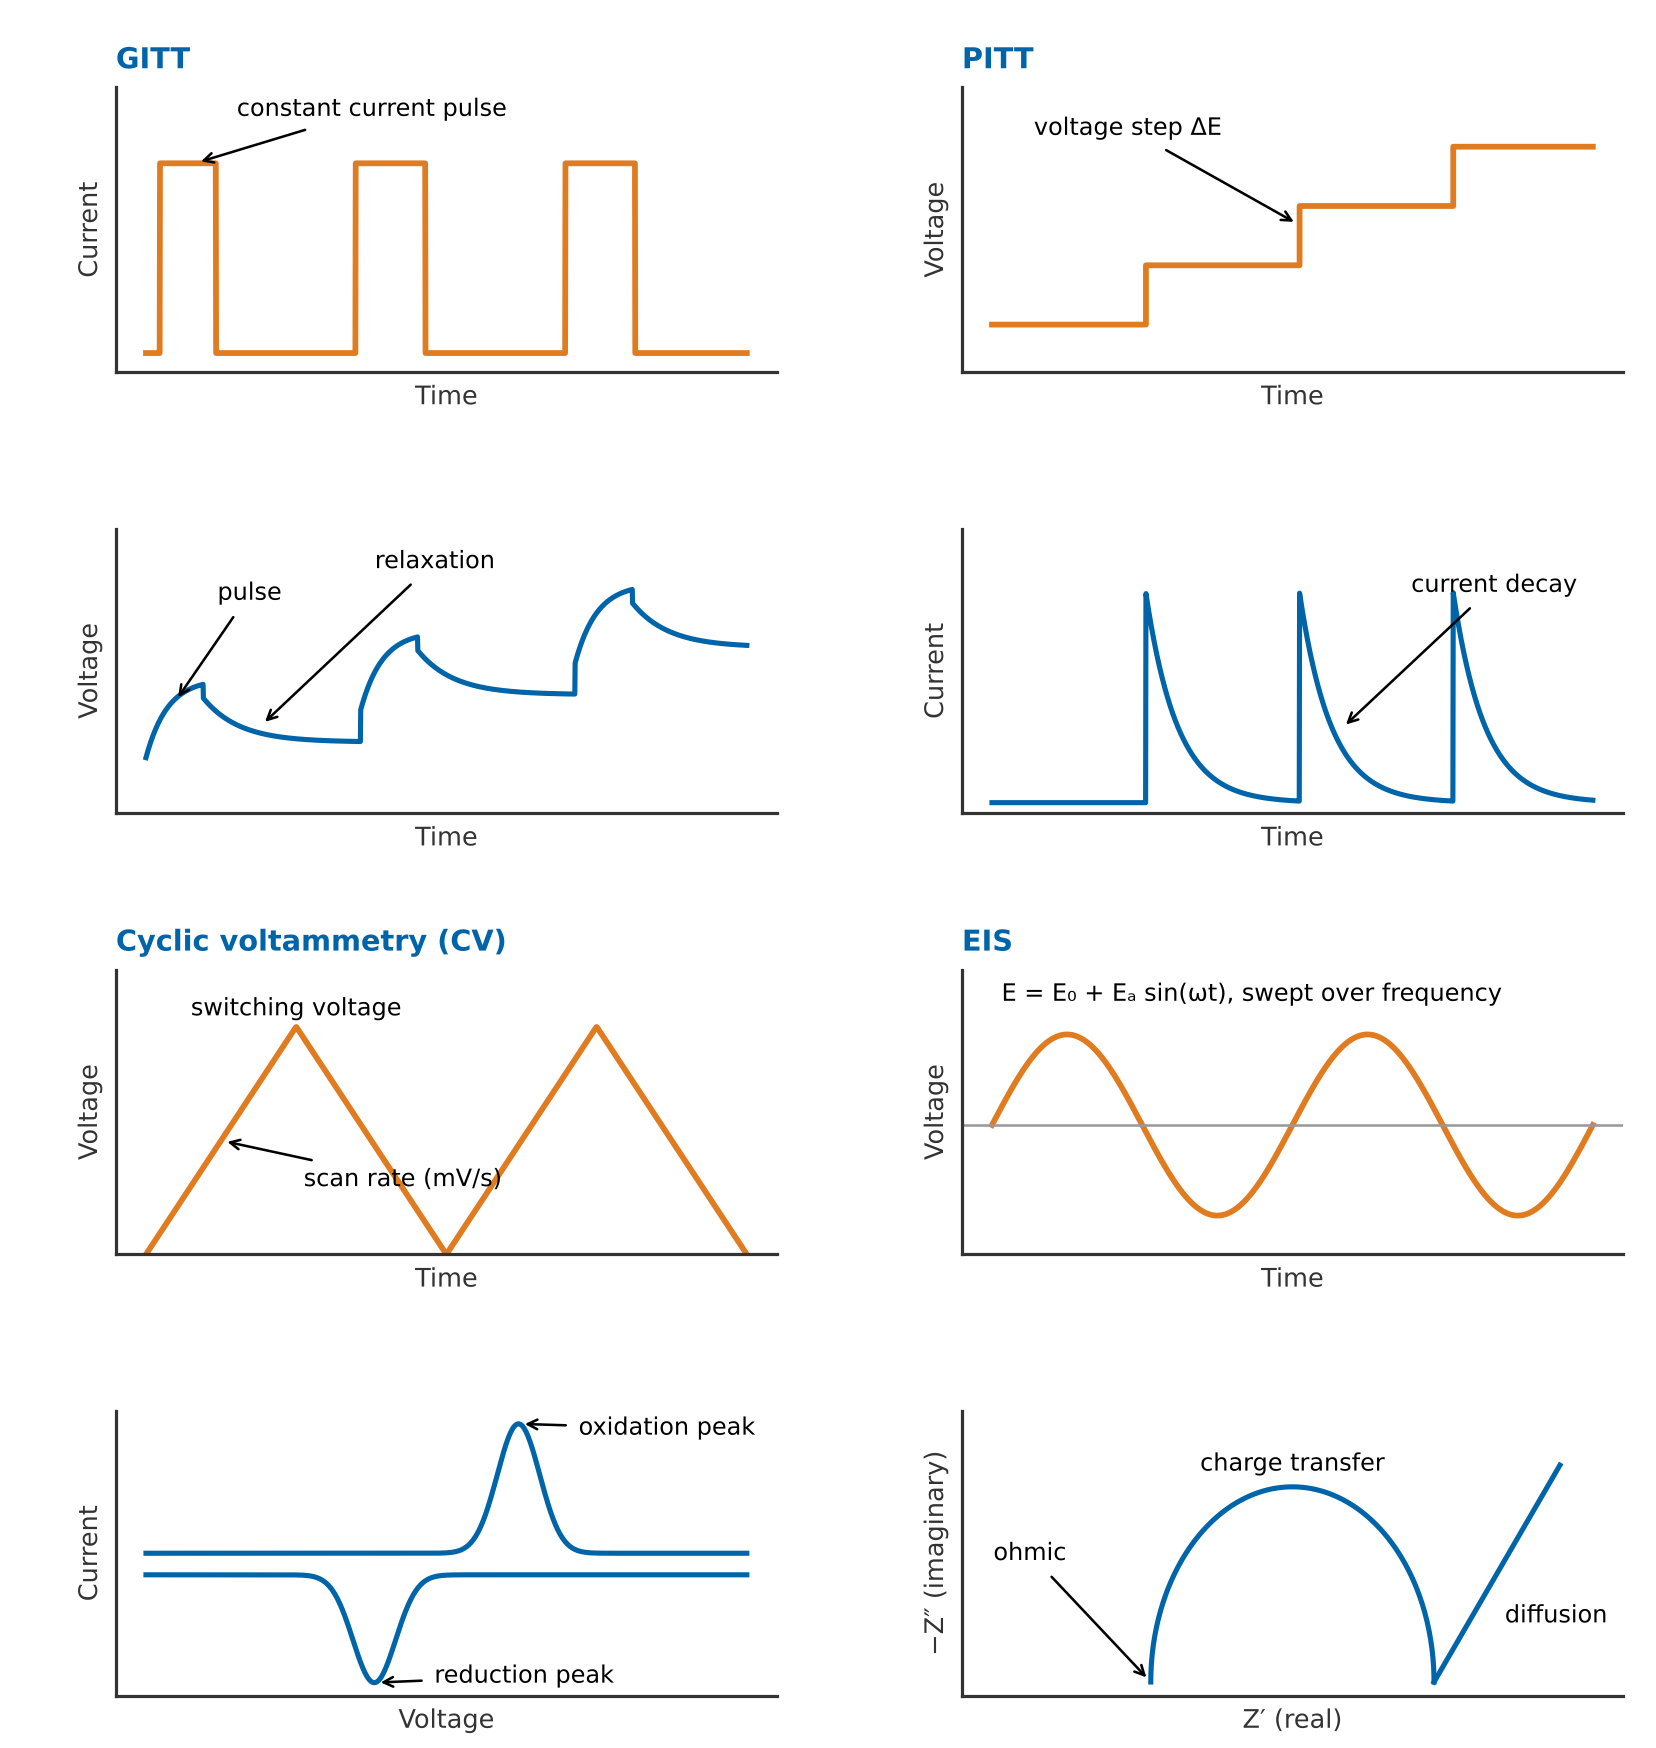
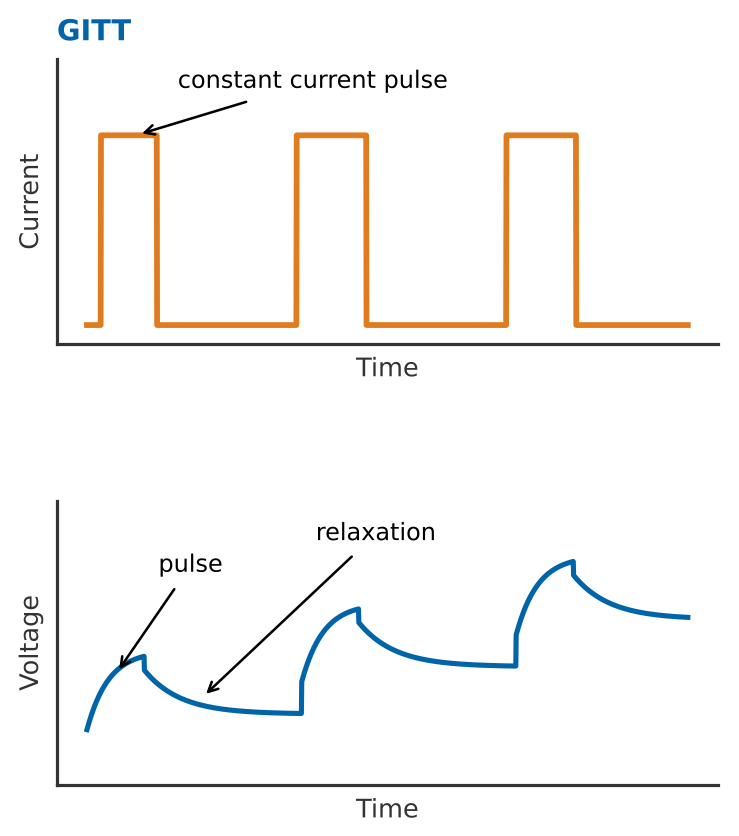
A constant current pulse is applied, followed by a rest until the voltage relaxes. The sequence repeats across the state-of-charge range. The voltage response during each pulse and relaxation gives the chemical diffusion coefficient and the open-circuit voltage curve of the electrode [3].
3PITT: Potentiostatic Intermittent Titration
A small voltage step ΔE is applied and held while the current decays; the step is repeated across the voltage window. The shape of the current decay gives the diffusion coefficient and reveals phase transitions [4].
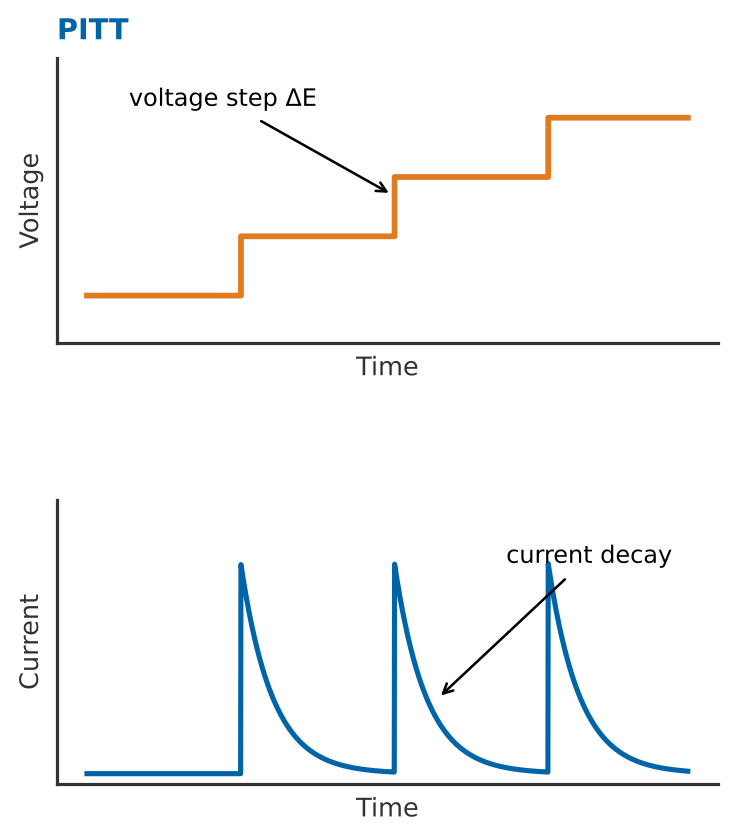
PITT uses the same Set value and step-limit building blocks as GITT, so it is programmed with standard MITS steps. Because the current tail falls to very low values, the auto-switching current ranges are what keep the decay accurate all the way down [2]. Contact [email protected] for a worked PITT schedule.
4Cyclic Voltammetry (CV)
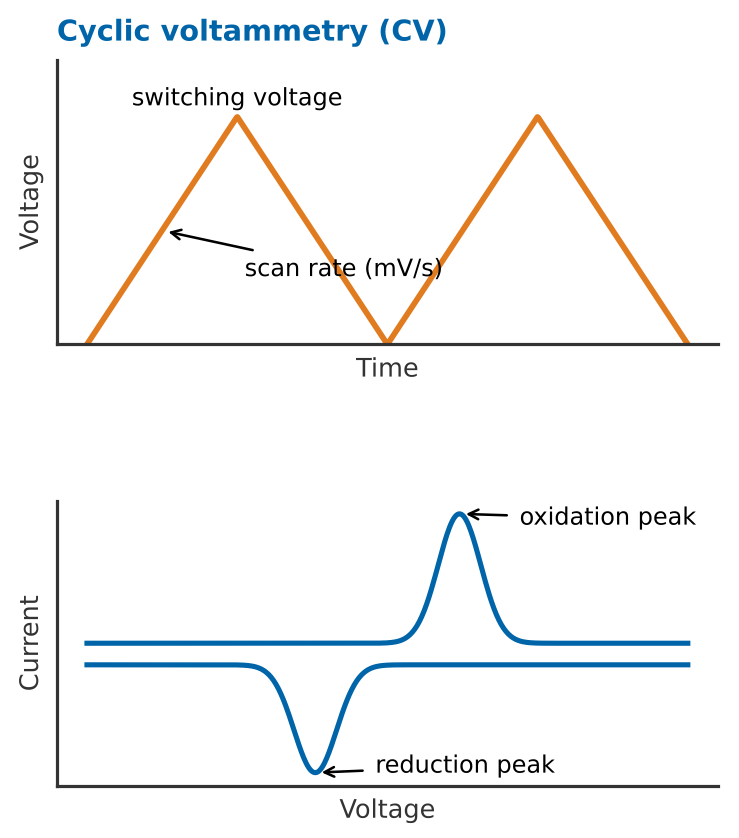
The voltage is swept linearly at a fixed scan rate between two switching voltages and back, while the current is recorded. Current peaks show the redox potentials, the reversibility of reactions and the electrochemical stability window of electrolytes and materials [5].
5Electrochemical Impedance Spectroscopy (EIS)
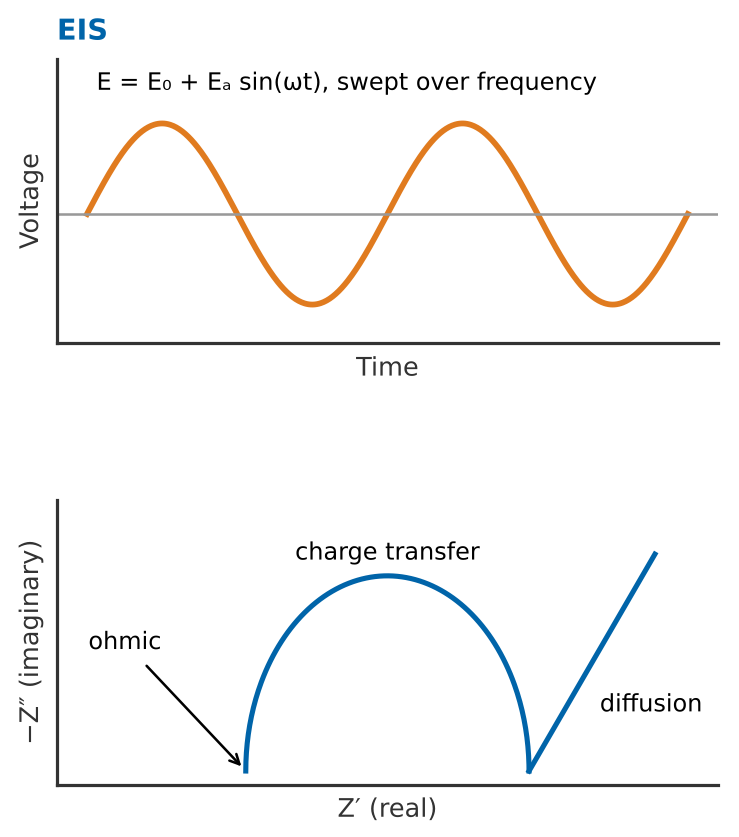
A small sinusoidal signal is applied over a range of frequencies and the impedance is measured. The Nyquist plot separates ohmic resistance, charge-transfer resistance and diffusion, so the processes that limit performance can be identified and tracked with ageing [6].
6Comparing the Four Techniques
The four methods differ in what they apply, what they measure and what they reveal, which is what makes them complementary rather than interchangeable.
Table 1. Summary of the four techniques
| Technique | Applied | Measured | Reveals |
|---|---|---|---|
| GITT | Current pulses and rests | Voltage | Diffusion coefficient, OCV vs SOC |
| PITT | Voltage steps | Current decay | Diffusion coefficient, phase transitions |
| CV | Linear voltage sweep | Current | Redox potentials, reversibility, stability window |
| EIS | Sinusoidal signal over frequency | Impedance | Ohmic, charge-transfer and diffusion resistance |
7How the Cycler Affects the Results
All four methods extract small signals: a few millivolts of relaxation, a decaying microampere current, a small peak, or a low-amplitude AC response. The cycler therefore sets the limit of what can be measured [2].
- Current ranges. PITT current tails and CV peaks reach very low currents, which need small, auto-switching ranges to stay accurate.
- Resolution and precision. Relaxation voltages in GITT and diffusion analysis rely on clean, low-noise readings.
- Timing and logging. Fast logging captures the start of each pulse or step; time accuracy matters for long relaxations.
- Bipolar operation. CV and EIS cross zero current, so charge and discharge must be smooth with no relay switching.
- Reference electrodes and temperature. Auxiliary voltage inputs enable three-electrode cells, and temperature control keeps results comparable.
24-bit resolution, ±0.01% FSR precision (below 10 ppm on HPS) and auto-switching current ranges down to 10 µA; 5 ms minimum step time; true bipolar circuitry; auxiliary voltage inputs; and integrated Gamry EIS to 100 kHz — all programmed in MITS [1][2].
For a system recommendation or a worked schedule for any of these techniques, contact [email protected] or +1 979 690 2751, or see the Arbin cell tester range.
References
- [1]Arbin Instruments, “Battery Cell Testers & Cyclers,” arbin.com/battery-test-equipment/cell-testers.html
- [2]Arbin Instruments, “How to Evaluate Battery Test Equipment,” rev. 4, PDF
- [3]W. Weppner and R. A. Huggins, “Determination of the kinetic parameters of mixed-conducting electrodes and application to the system Li3Sb,” J. Electrochem. Soc., vol. 124, p. 1569, 1977.
- [4]C. J. Wen, B. A. Boukamp, R. A. Huggins and W. Weppner, “Thermodynamic and mass transport properties of LiAl,” J. Electrochem. Soc., vol. 126, p. 2258, 1979.
- [5]A. J. Bard and L. R. Faulkner, Electrochemical Methods: Fundamentals and Applications, 2nd ed. Hoboken, NJ: Wiley, 2001.
- [6]A. Lasia, Electrochemical Impedance Spectroscopy and its Applications. New York: Springer, 2014.
Systems in this note
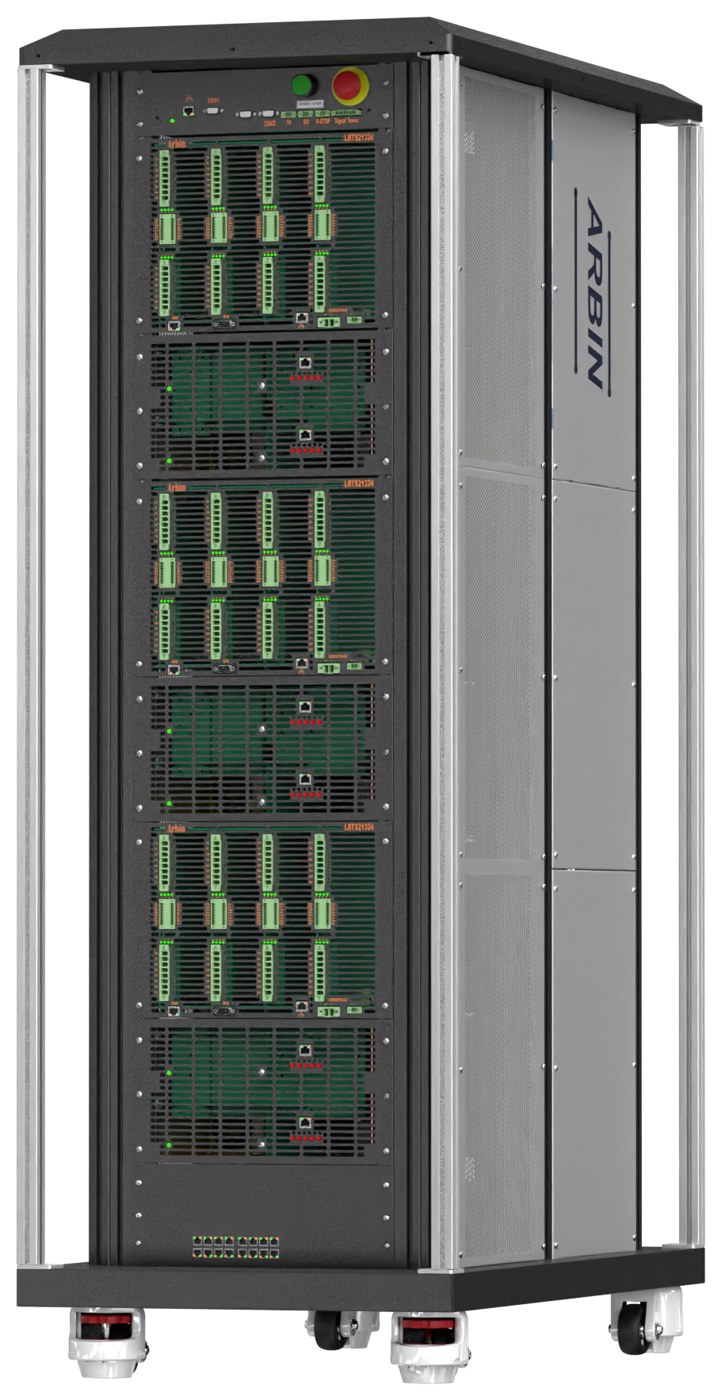
Arbin Cell Testers
True bipolar circuitry, auto-switching current ranges from 10 µA, 24-bit measurement, auxiliary voltage inputs for three-electrode cells and integrated Gamry EIS — every technique in this note runs on one platform.
Which technique answers your question?
Tell us what you are trying to measure and on what material. An applications engineer will recommend the method, the configuration and a starting schedule.
Related application notes
Resistance, measurement quality and system selection on Arbin systems.
What Is Battery Internal Resistance?
What ACIR, DCIR and R₀ actually mean, and how to measure them.
Read note →Hybrid Pulse Power Characterization (HPPC) Testing
Pulse resistance and pulse power, measured on an Arbin HPS.
Read note →What Is a Battery Cycler?
How a cycler works and the specifications that decide data quality.
Read note →How to Evaluate Battery Test Equipment
Resolution, precision, accuracy and current ranges, in full.
Open PDF →