 English
 简体中文
 한국어

What Is Battery Internal Resistance?
Summary
Internal resistance combines ohmic, SEI, charge-transfer and diffusion contributions that appear on different timescales, so the measured value depends on the method. This note explains what ACIR, DCIR and R0 actually mean, and how to measure them on Arbin systems with the built-in Internal resistance step or an IEC 61960 schedule.
1Why Internal Resistance Matters
Internal resistance is one of the most informative single parameters of a battery cell. It determines how much the voltage drops under load, how much heat the cell generates, and how much power it can deliver. Yet internal resistance values reported by different instruments, standards and datasheets often disagree, because the term covers several physical processes that act on different timescales, and the measured value depends strongly on how and when the voltage is read [1].
This note explains what internal resistance consists of, how the measurement method affects the result, and how to perform reliable measurements on Arbin systems — using either the built-in Internal resistance control step or a user-programmed IEC 61960 procedure.
1.1What Internal Resistance Decides
- Power capability and voltage sag. The voltage drop under load is roughly I × R. A higher resistance means the cell reaches its cut-off voltage sooner at high current, reducing usable capacity and peak power.
- Heat generation and safety. Resistive losses produce heat proportional to I² × R, so doubling the current quadruples the heat. This drives thermal management design, and high temperatures accelerate aging and can ultimately trigger thermal runaway.
- Efficiency. Energy lost as heat in the internal resistance lowers round-trip efficiency, because that energy never reaches the load or gets stored.
- State of health and aging. Resistance rises as a cell ages, mainly because the SEI layer thickens, the electrolyte slowly decomposes and electrode particles lose contact with each other [2].
- Cell matching. In parallel, more current flows through the lower-resistance cell, so it works harder; in series, the higher-resistance cell heats more and reaches its voltage limits first. Matched resistance keeps cells aging evenly [7].
- Quality control. Manufacturing defects, poor welds and damaged cells add resistance in the current path, so an abnormal value is an early warning sign.
- Modeling. A battery management system needs R to separate the current-induced voltage drop from the OCV, which is what indicates state of charge.
2Fundamentals
2.1Basic Definition
When no current flows, a battery’s terminal voltage equals its open-circuit voltage (OCV). When a current I flows, the terminal voltage changes to Vload. In the simplest model, the battery is an ideal voltage source (OCV) in series with a resistor R:
For example, a cell at 4.00 V open-circuit that drops to 3.90 V while delivering 2 A has R = 0.10 V / 2 A = 50 mΩ. In this note, I is taken as positive for discharge, so Vload is below OCV; for a charge pulse, taking I as negative keeps the formula valid.
This model is a useful starting point, but a real battery is not just a resistor: several internal processes respond to current on different timescales, so the measured value depends on when the voltage is read, the state of charge, the temperature and how the measurement is made.
2.2Components of Internal Impedance
Strictly speaking, a battery has an internal impedance made of several contributions that act on different timescales.
Table 1. Contributions to the internal impedance of a lithium-ion cell
| Contribution | Physical origin | Typical timescale |
|---|---|---|
| Ohmic resistance R0 | Electrolyte, separator, electrodes, current collectors, tabs | Instantaneous |
| SEI resistance | Ion transport through the solid electrolyte interphase film on the anode; grows with aging | Sub-millisecond to milliseconds |
| Charge-transfer resistance | Electrochemical reactions at the electrode surfaces (with double-layer capacitance) | Milliseconds to about 1 s |
| Diffusion | Limited ion transport through the electrodes and electrolyte | Seconds to minutes, growing with pulse length |
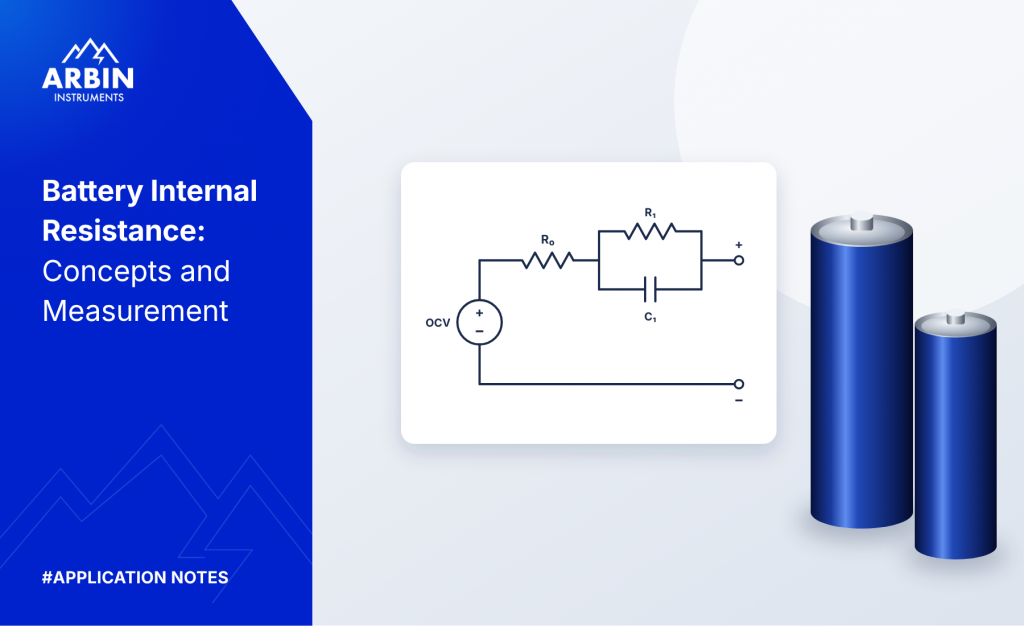
Battery models usually represent the cell as R0 in series with one or more RC pairs, each capturing one of the slower effects [3]. When current starts, the voltage drops instantly by I × R0, then continues to sag gradually, because the capacitor in each RC pair takes time to charge with a time constant τ = R × C. Physically, diffusion is better described by a Warburg element, which has no single time constant because ions diffuse over a continuous range of distances into the electrode particles; RC pairs are a practical approximation of it [4].
3Internal Resistance Values and How They Differ
Because “internal resistance” is used loosely, a quoted value is only meaningful together with how it was measured [1].
Table 2. Common types of internal resistance values
| Value | How it is measured | What it includes |
|---|---|---|
| AC internal resistance (ACIR) | Small AC signal, typically at 1 kHz | Close to R0; each 1 ms cycle reverses the current before charge transfer and diffusion can build up |
| DC internal resistance (DCIR) | Current pulse, voltage read at a specified time | R0 plus the polarization that develops during the pulse; often significantly larger than R0, especially in the cold |
| Electrochemical impedance spectroscopy (EIS) | AC signal swept across a range of frequencies | Separates all contributions, because each process responds in its own frequency range [4] |
R0 describes the instantaneous voltage drop. DCIR at a relevant pulse length is more useful for predicting voltage sag and power capability, because real loads last seconds or longer — long enough for polarization to add to the drop.
3.1DCIR Depends on Pulse Length
DCIR is not a single fixed property of the battery. It includes R0 plus whatever polarization has built up by the moment the voltage is read.
Table 3. Contributions included in a DCIR value as a function of pulse length
| Pulse length | Contributions included |
|---|---|
| About 1 ms | Approximately R0; the fastest SEI and charge-transfer processes may already contribute slightly |
| About 0.1 to 1 s | R0 plus most or all of the charge-transfer resistance |
| 10 s or longer | R0 plus charge transfer plus a growing diffusion contribution |
A DCIR value must always be reported with its conditions — for example “DCIR at 10 s pulse, 50% SOC, 25 °C”. Resistance rises at low temperature, because ion transport and reactions slow down, and near empty or full charge, because fewer reaction sites are available.
4Measuring the Ohmic Resistance R0
An accurate, repeatable R0 measurement follows these steps.
- Rest the cell until the voltage has fully relaxed (often one hour or more), because concentration differences left by earlier current take a long time to even out through diffusion. For chemistries with OCV hysteresis, such as LFP, approach the test SOC from a consistent direction, because the relaxed OCV depends on whether the cell was last charged or discharged.
- Fix and record the conditions. Test at a known temperature and state of charge, because the resistance depends on both.
- Use 4-wire (Kelvin) sensing directly at the cell terminals. The sense leads carry almost no current, so wire and contact resistance are excluded from the result.
- Apply a short current pulse that is large enough to produce a clearly measurable voltage drop compared with the measurement resolution and noise, but short enough not to change the state of charge or heat the cell.
- Read Vload as soon as the current has stabilized, typically within about 1 ms. Reading earlier captures the switching transient from cable inductance and the load’s rise time; reading later adds polarization. At this point the reading is a close approximation of R0, not a pure measurement.
- Calculate R0 = (OCV − Vload) / I.
Arbin LBT systems use 4-wire (Kelvin) connections by default, measure with 24-bit resolution and low noise — so the pulse can be kept small — and log data at 1 kHz as standard (one point every 1 ms). A 10 kHz burst mode (one point every 0.1 ms) captures the voltage step in finer detail.
4.1Cross-Check: Current Interruption
The same R0 can be measured when the current is switched off. While current I flows, the voltage sits at Vload; when the current is cut, the voltage first jumps quickly by the ohmic part, then creeps slowly toward OCV as polarization relaxes:
If the switch-on and switch-off results agree, the measurement is likely sound, because errors such as a wrong sampling time or a poor connection usually affect the two edges differently.
5The Two-Current Method and IEC 61960
5.1Principle
The two-current method avoids the need for an accurate OCV. The cell is discharged at a first current I1 and then at a second, higher current I2, and the voltage is recorded at the end of each step. In the simple model, V1 = E − I1 × R and V2 = E − I2 × R, where E is the cell’s underlying source voltage. Because E is the same in both readings, it cancels when the two equations are subtracted:
The formula only requires the two currents to differ, but the low-then-high order is used for three reasons: a large current step gives a large voltage difference, keeping meter resolution and noise small relative to the signal; the longer low-current step brings the cell to a steady, mildly polarized state first, so the short high pulse is a clean response on top of it rather than a reading disturbed by relaxation; and the short high pulse limits heating and state-of-charge change, which would otherwise change E between the two readings.
5.2Why Both Steps Are Discharge Steps
- Charge and discharge resistance differ. The electrode reactions run in opposite directions and do not proceed equally easily both ways. With two discharge steps, one resistance applies to both readings, as the formula assumes.
- Polarization builds in one direction. The second step adds polarization on top of the first, instead of first having to reverse it.
- The standard characterizes discharge performance, which is what matters for portable devices.
- Cell protection. A strong charge pulse on a charged cell could exceed its maximum voltage or cause lithium plating.
5.3IEC 61960 Measurement Procedure
IEC 61960-3 (clause 7.7.3) [5] specifies the DC internal resistance as a two-step discharge at 0.2 It for 10 s followed immediately by 1.0 It for 1 s, where It is the rated capacity divided by one hour. Scaling the currents to the capacity keeps results comparable between cells of different sizes. For example, a 3 Ah cell gives It = 3 A, I1 = 0.6 A and I2 = 3 A.
- Preconditioning. Bring the cell to the charge state, rest time and ambient temperature specified in IEC 61960-3, typically with a charge step followed by a rest step.
- First discharge. Constant-current discharge at I1 = 0.2 It for 10 s ± 0.1 s. At the end of the step, record U1 and the measured current I1.
- Second discharge. Go directly, with no rest, to a constant-current discharge at I2 = 1.0 It for 1 s, because even a short pause would let the cell start relaxing. At the end of the step, record U2 and the measured current I2.
- Calculation. Use the measured rather than the set currents, so that small current deviations do not enter the result.
Validity checks: step 2 lasted 10 s ± 0.1 s; the transition to step 3 was immediate; I2 > I1; the voltage stayed above the minimum limit; and RDC is positive. Report RDC together with U1, U2, I1, I2, the rated capacity and the cell temperature.
Record data at intervals of 10 ms or less near the end of each step, so that the recorded end value is within about 1% of the 1 s step duration, and use 4-wire sensing. Measuring a known resistor in series with a stable power supply is a simple way to verify the setup.
Arbin LBT systems measure current and voltage with a precision of 0.01% and an accuracy of 0.02%, so the recorded values are reliable. The standard 1 kHz logging rate (one point every 1 ms) meets the IEC timing requirement with a tenfold margin.
5.4Programming IEC 61960 on Arbin Systems
Figure 1 shows the IEC 61960 procedure programmed as a schedule in the Arbin test software (Internal_Resistance_IEC61960.sdx). Each line is one step: two C-rate discharge steps carry out the measurement, Set value steps store the measured currents and voltages in user-defined meta variables, and a final Set value step calculates the DC resistance with a formula.
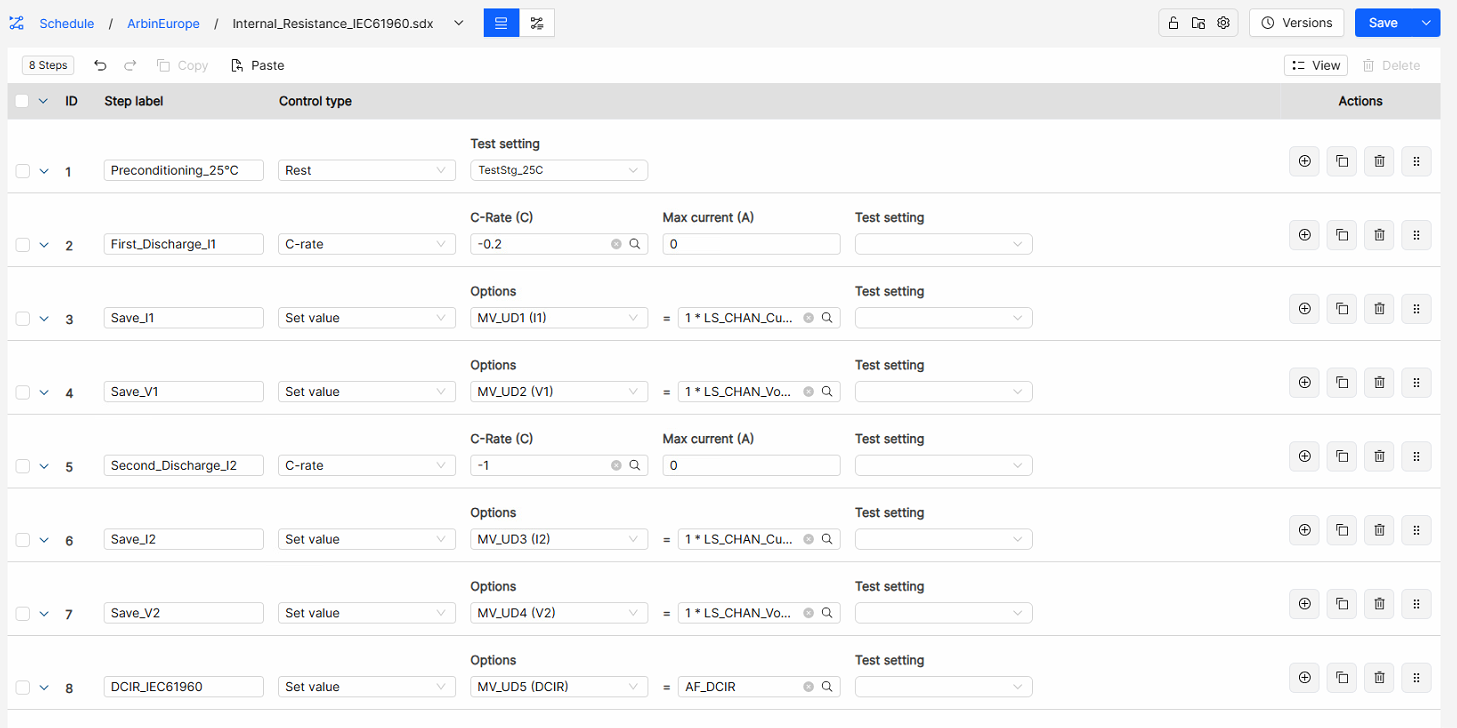
Table 4. IEC 61960 schedule steps
| ID | Step label | Control type | Setting | Function |
|---|---|---|---|---|
| 1 | Preconditioning_25°C | Rest | Test setting TestStg_25C | Holds the cell at 25 °C before the measurement |
| 2 | First_Discharge_I1 | C-rate | −0.2 C | Discharges at I1 = 0.2 It for 10 s |
| 3 | Save_I1 | Set value | MV_UD1 = 1 × LS_CHAN_Current | Stores the measured current at the end of step 2 as I1 |
| 4 | Save_V1 | Set value | MV_UD2 = 1 × LS_CHAN_Voltage | Stores the voltage at the end of the first discharge as U1 |
| 5 | Second_Discharge_I2 | C-rate | −1 C | Discharges at I2 = 1.0 It for 1 s |
| 6 | Save_I2 | Set value | MV_UD3 = 1 × LS_CHAN_Current | Stores the measured current at the end of step 5 as I2 |
| 7 | Save_V2 | Set value | MV_UD4 = 1 × LS_CHAN_Voltage | Stores the voltage at the end of the second discharge as U2 |
| 8 | DCIR_IEC61960 | Set value | MV_UD5 = AF_DCIR | Calculates RDC from the stored values with a formula |
The C-rate control type scales the currents to the capacity in the cell definition, so the same schedule can be reused for cells of any size. When the cell is not already at the charge state specified in IEC 61960-3, a standard charge step and rest are added before step 1.
Arbin counts discharge current as negative, so the C-rates are entered as −0.2 C and −1 C, and I1 and I2 are stored as negative values. To obtain a positive resistance, the formula AF_DCIR uses the magnitudes of the currents:
Step limits. Step 2 ends when PV_CHAN_Step_Time ≥ 10 s and step 5 when PV_CHAN_Step_Time ≥ 1 s, with PV_CHAN_Voltage ≤ Vmin → end as a safety limit on both. The Set value steps end at PV_CHAN_Step_Time ≥ 0, so that the second discharge follows the first without a pause.
Enter the rated capacity of the cell in the cell definition, because IEC 61960 defines It from the rated capacity. Log at DV_Time ≥ 0.01 s or faster on steps 2 and 5, so that the end-of-step values meet the timing requirement.
5.5Other Standards: HPPC
For electric and hybrid vehicle applications, one of the most widely used resistance tests is the Hybrid Pulse Power Characterization (HPPC) test, defined in the U.S. Department of Energy’s FreedomCAR Battery Test Manual [6]. It applies a 10 s discharge pulse, a 40 s rest and a 10 s regenerative (charge) pulse at 75% of the discharge current, and repeats this sequence at 10% depth-of-discharge intervals, with a one-hour rest before each sequence. The voltage change during each pulse gives both the discharge and the charge resistance as a function of state of charge. It is the same ΔV / ΔI principle as the methods above, but mapped across the full SOC range, which is why HPPC data is commonly used to parameterize battery models. HPPC can be programmed on Arbin systems with standard steps — see application note AN-024.
6Internal Resistance Measurement on Arbin Systems
6.1The Arbin Internal Resistance Step
In addition to user-programmed procedures, Arbin systems provide a dedicated Internal resistance control step based on a symmetric pulse train — a generalization of the two-current method. The current alternates between I0 + IIR and I0 − IIR, where I0 is the offset (the average current) and IIR is the pulse amplitude. The voltage is sampled at the end of a high half-cycle (P2) and at the end of the following low half-cycle (P3), and the result is averaged over 10 pulses:
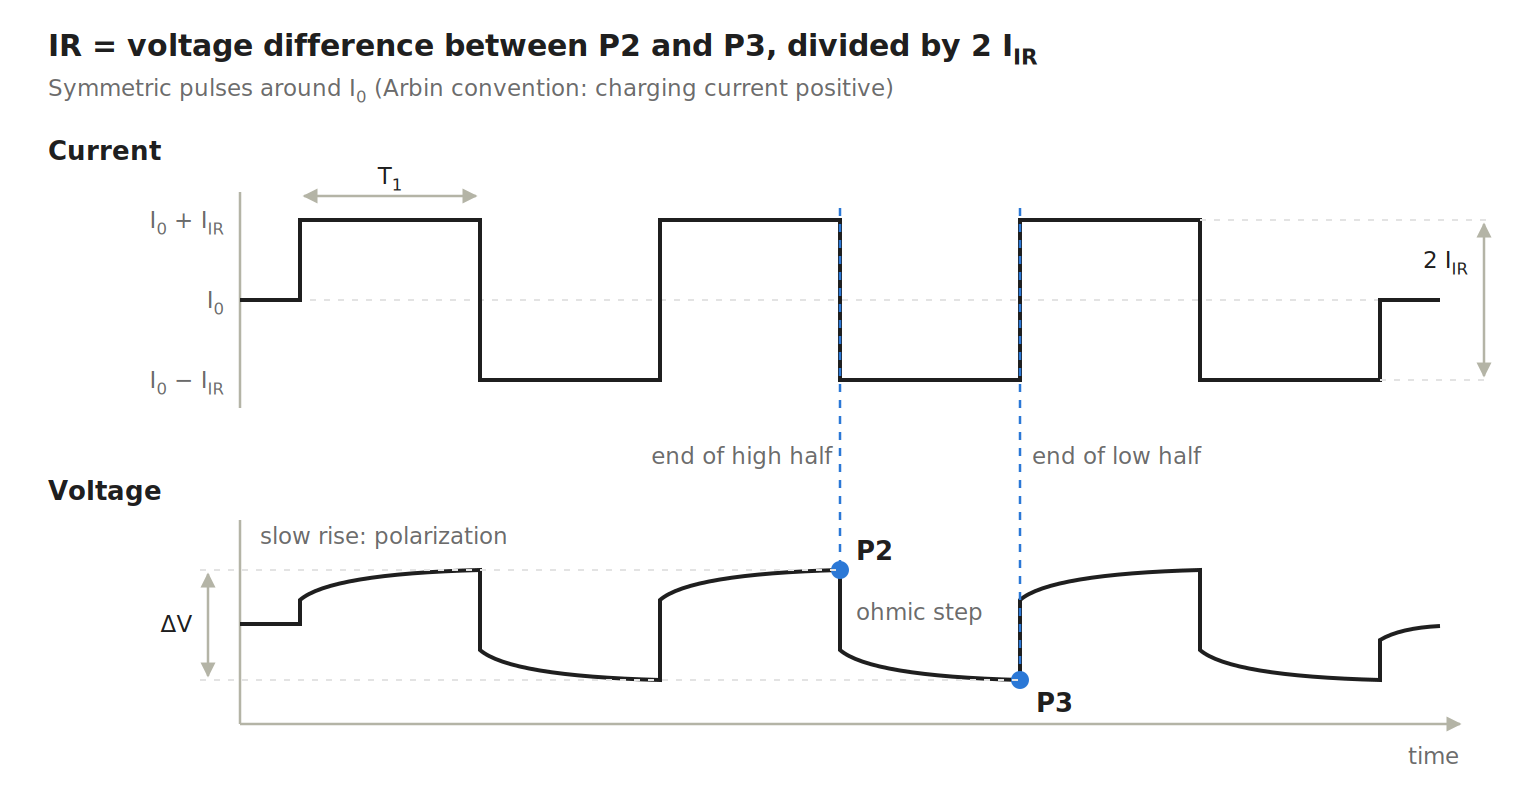
At each current change, the voltage steps instantly (the ohmic part), then keeps moving slowly as polarization builds. Arbin counts charging current as positive, which is why the voltage rises during the high half-cycle and VP2 − VP3 is positive. With the discharge-positive convention used in the earlier sections, the same result is written (VP3 − VP2) / (2 × IIR).
The method offers three advantages over a single pulse:
- Zero net charge (when I0 = 0): the charge removed in each half-cycle is returned in the next, so the state of charge does not drift and concentration polarization cannot accumulate.
- Averaging: averaging 10 pulses reduces random noise by roughly a factor of √10 ≈ 3, which matters because the voltage differences are often only a few millivolts.
- Short pulses: the sampling time T1 equals the half-cycle width and can be set from 1 ms to 1000 ms. Short pulses keep polarization small, because it has little time to build up.
The reported value is a DCIR at the sampling time T1, not a pure R0: even at 1 ms, fast SEI and charge-transfer processes may already contribute. Always report T1, IIR, I0, SOC and temperature with the result.
6.2Choosing the Offset I₀
With I0 = 0, the pulses alternate between charge and discharge, so the result is effectively an average of the charge and discharge resistance. A non-zero offset is useful in several situations:
- Direction-specific resistance. With I0 larger than IIR, both half-cycles flow in the same direction, giving a pure charge or pure discharge resistance. Because positive current means charging, a negative I0 is needed for the discharge side.
- Measurements during a test. Setting I0 to the current already flowing in a cycling test superimposes the pulses without interrupting it, which allows resistance to be tracked as a function of SOC.
- Operating point. At higher currents the charge-transfer resistance becomes nonlinear, so a cell used at 2 A is best characterized around 2 A.
- Avoiding the zero crossing. Keeping the current on one side of zero avoids switching between charge and discharge, which on some hardware adds a short transient.
With I0 ≠ 0, net charge flows during the measurement, but the effect is usually negligible: with I0 = 1 A and a measurement lasting about 0.3 s, roughly 0.09 mAh flows — about 0.003% of a 3 Ah cell.
6.3Programming an Internal Resistance Step
Each field in the step dialog corresponds directly to a parameter of the pulse train (Figure 3).

Table 5. Interface fields and their meaning
| Interface field | Symbol | Meaning | Example value |
|---|---|---|---|
| Control type | – | Selects the internal resistance measurement | Internal resistance |
| Amplitude (A) | IIR | Current step above and below the offset | 0.1 A |
| ms | T1 | Width of each half-cycle, which is also the sampling time | 10 ms |
| Offset | I0 | Average current around which the pulses alternate | 0 A |
| Step transitions | – | What the test does after the measurement | Go to next step |
With these values, the current alternates between +0.1 A and −0.1 A in 10 ms half-cycles, so the current difference is 0.2 A and no net charge flows. A voltage difference of 1 mV between P2 and P3 corresponds to IR = 1 mV / 0.2 A = 5 mΩ, a DCIR at 10 ms.
With 24-bit resolution, Arbin LBT systems resolve voltage differences well below 1 mV, so small amplitudes still give a clean result.
6.4Arbin Internal Resistance Step versus IEC 61960
Both methods follow the same principle, R = ΔV / ΔI, but they measure different quantities and serve different purposes.
Table 6. Comparison of the Arbin Internal resistance step and the IEC 61960 procedure
| Arbin Internal resistance step | IEC 61960 procedure | |
|---|---|---|
| Current sequence | Symmetric pulses around I0, repeated 10 times | One step at 0.2 It, then one step at 1.0 It |
| Current direction | Charge and discharge (I0 = 0), or one direction with I0 > IIR | Discharge only |
| Timing | Half-cycles of 1 ms to 1000 ms | 10 s followed by 1 s |
| Net charge | Zero when I0 = 0 | Small discharge |
| Result | DCIR at T1, close to R0 for short pulses | DCIR including more polarization |
| Typical use | Fast, low-disturbance tracking of aging and cell screening | Standardized values for specifications and comparisons |
The Internal resistance step is not the IEC 61960 procedure, and its results should not be compared directly with IEC values. When an IEC 61960 measurement [5] is required, it can be programmed on any Arbin system with the two consecutive constant-current discharge steps described in section 5.
7Summary
Internal resistance is not a single number: it combines ohmic, SEI, charge-transfer and diffusion contributions that appear on different timescales, so every value must be reported with its measurement method and conditions.
Arbin systems support both approaches covered in this note. The built-in Internal resistance step provides fast, averaged measurements with zero net charge — ideal for tracking aging and screening cells — while standard constant-current steps allow fully IEC 61960-compliant DC resistance measurements for specifications and comparisons.
For more information or training on internal resistance measurements with Arbin systems, contact [email protected] or +1 979 690 2751, or see the Arbin cell tester range.
References
- [1]H.-G. Schweiger, O. Obeidi, O. Komesker, A. Raschke, M. Schiemann, C. Zehner, M. Gehnen, M. Keller and P. Birke, “Comparison of Several Methods for Determining the Internal Resistance of Lithium Ion Cells,” Sensors, vol. 10, no. 6, pp. 5604–5625, 2010. doi:10.3390/s100605604
- [2]J. Vetter, P. Novák, M. R. Wagner, C. Veit, K.-C. Möller, J. O. Besenhard, M. Winter, M. Wohlfahrt-Mehrens, C. Vogler and A. Hammouche, “Ageing mechanisms in lithium-ion batteries,” Journal of Power Sources, vol. 147, no. 1–2, pp. 269–281, 2005. doi:10.1016/j.jpowsour.2005.01.006
- [3]G. L. Plett, Battery Management Systems, Volume I: Battery Modeling. Norwood, MA: Artech House, 2015.
- [4]E. Barsoukov and J. R. Macdonald (eds.), Impedance Spectroscopy: Theory, Experiment, and Applications, 3rd ed. Hoboken, NJ: Wiley, 2018.
- [5]IEC 61960-3:2017, Secondary cells and batteries containing alkaline or other non-acid electrolytes – Secondary lithium cells and batteries for portable applications – Part 3: Prismatic and cylindrical lithium secondary cells and batteries made from them. Geneva: International Electrotechnical Commission, 2017.
- [6]U.S. Department of Energy, FreedomCAR Battery Test Manual for Power-Assist Hybrid Electric Vehicles, October 2003.
- [7]Arbin Instruments, “Battery Cell Grading and Matching,” Application Note AN-025, 2026. Read the note
Systems in this note
Arbin LBT Cell Testers
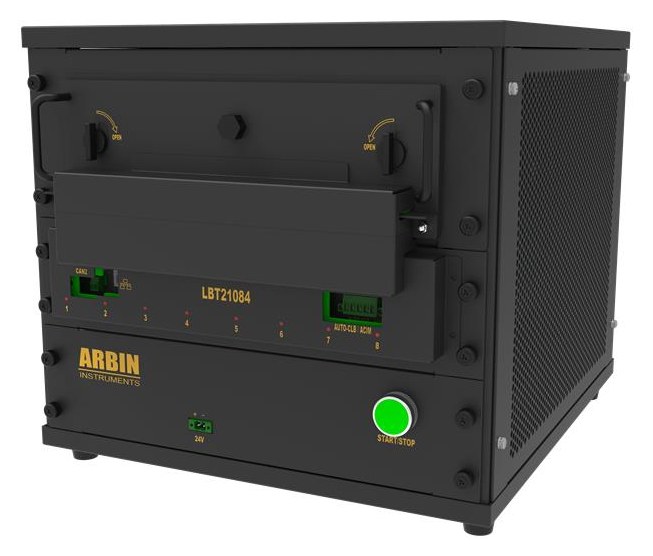
4-wire Kelvin sensing as standard, 24-bit measurement, ±0.02% accuracy and ±0.01% precision, 1 kHz standard logging with a 10 kHz burst mode, and a dedicated Internal resistance control step — all on the MITS platform.
Measuring resistance on your cells?
Tell us your cell format, capacity and the standard you need to meet. An applications engineer will recommend a system and a schedule.
Related application notes
Resistance, power and measurement quality on Arbin systems.
Hybrid Pulse Power Characterization (HPPC) Testing
Pulse resistance and pulse power, measured on an Arbin HPS.
Read note →Battery Cell Grading and Matching
Why measurement precision determines how narrowly cells can be binned.
Read note →What Is a Battery Cycler?
How a cycler works and the specifications that decide data quality.
Read note →How to Evaluate Battery Test Equipment
Resolution, precision and accuracy, in full.
Open PDF →