


Yes. Arbin Data Watcher software (Version 2.2.217 and later) can do this.
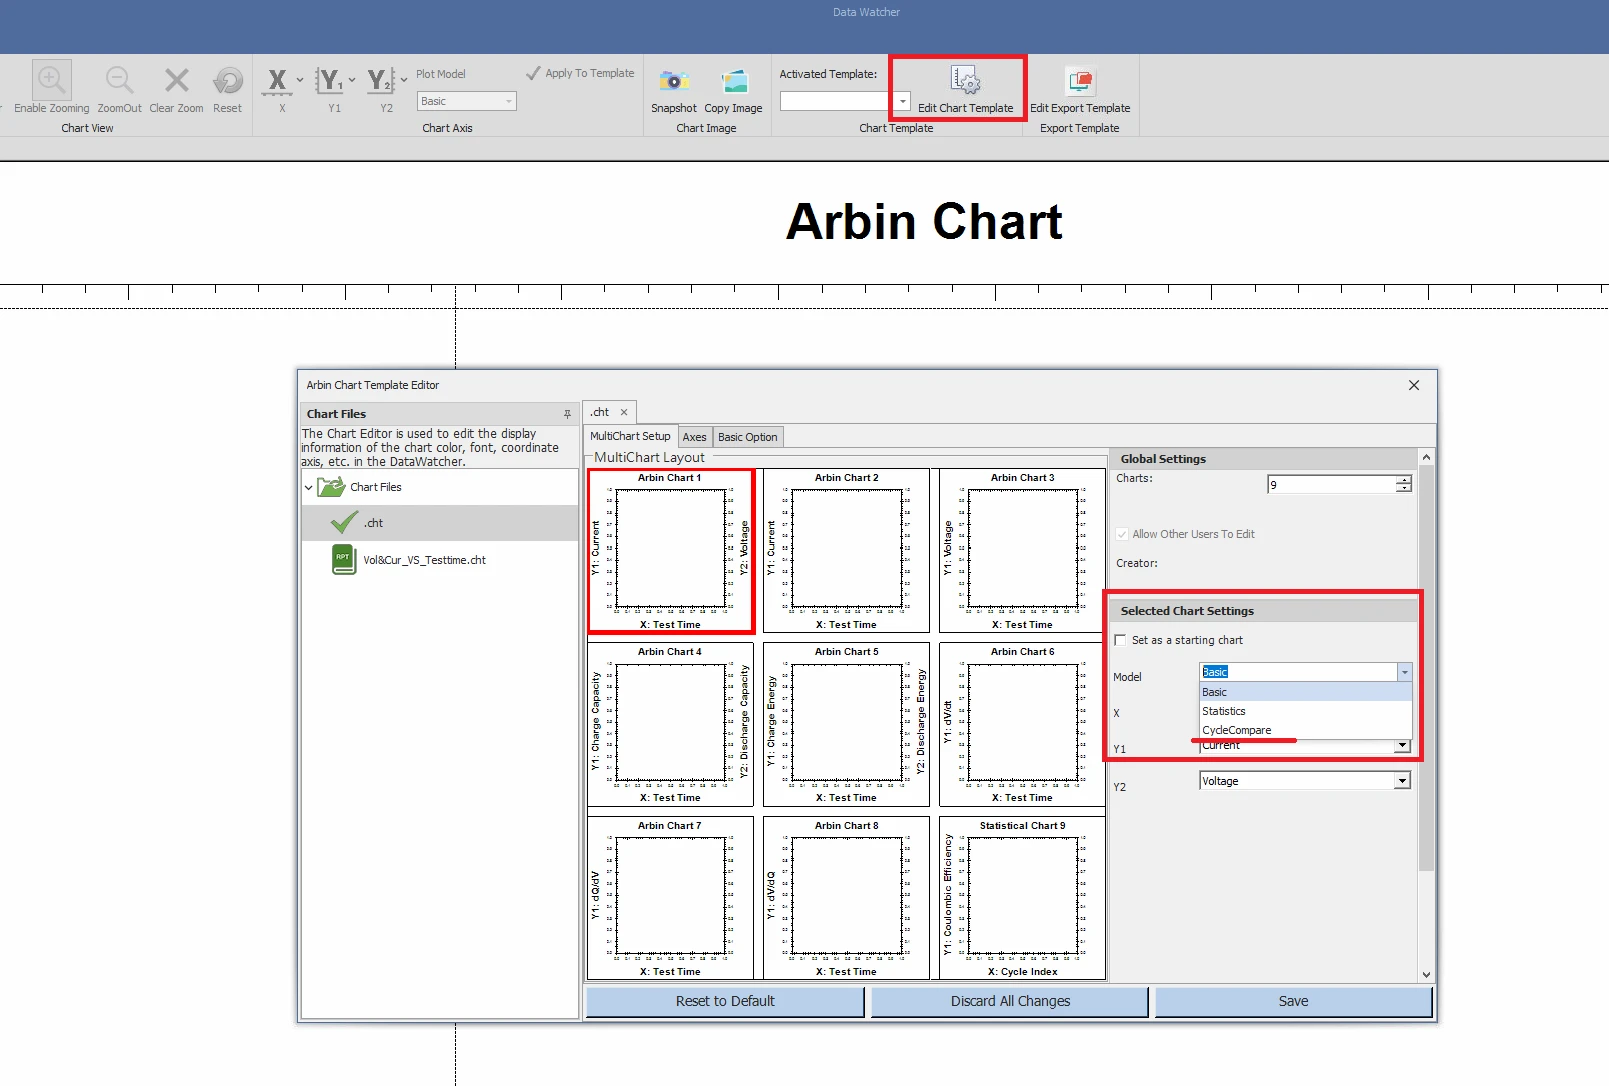
In Data Watcher software, click “Edit Chart Template”.
From the Model dropdown, select “CycleCompare”.
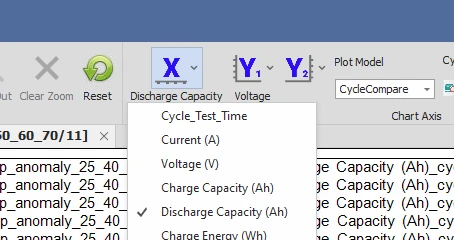
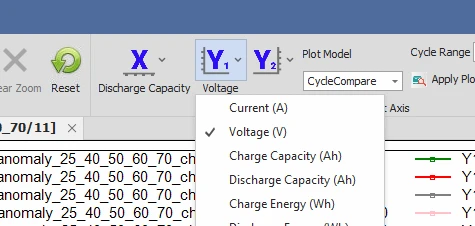
Return to the main window of Data Watcher.
In the axis configuration, you can select the physical quantity for the X, Y1, and Y2 axes. In this example, X is Voltage, and Y1 is Discharge Capacity.
You will see a comparison between cycles as follows (each line represents a cycle):
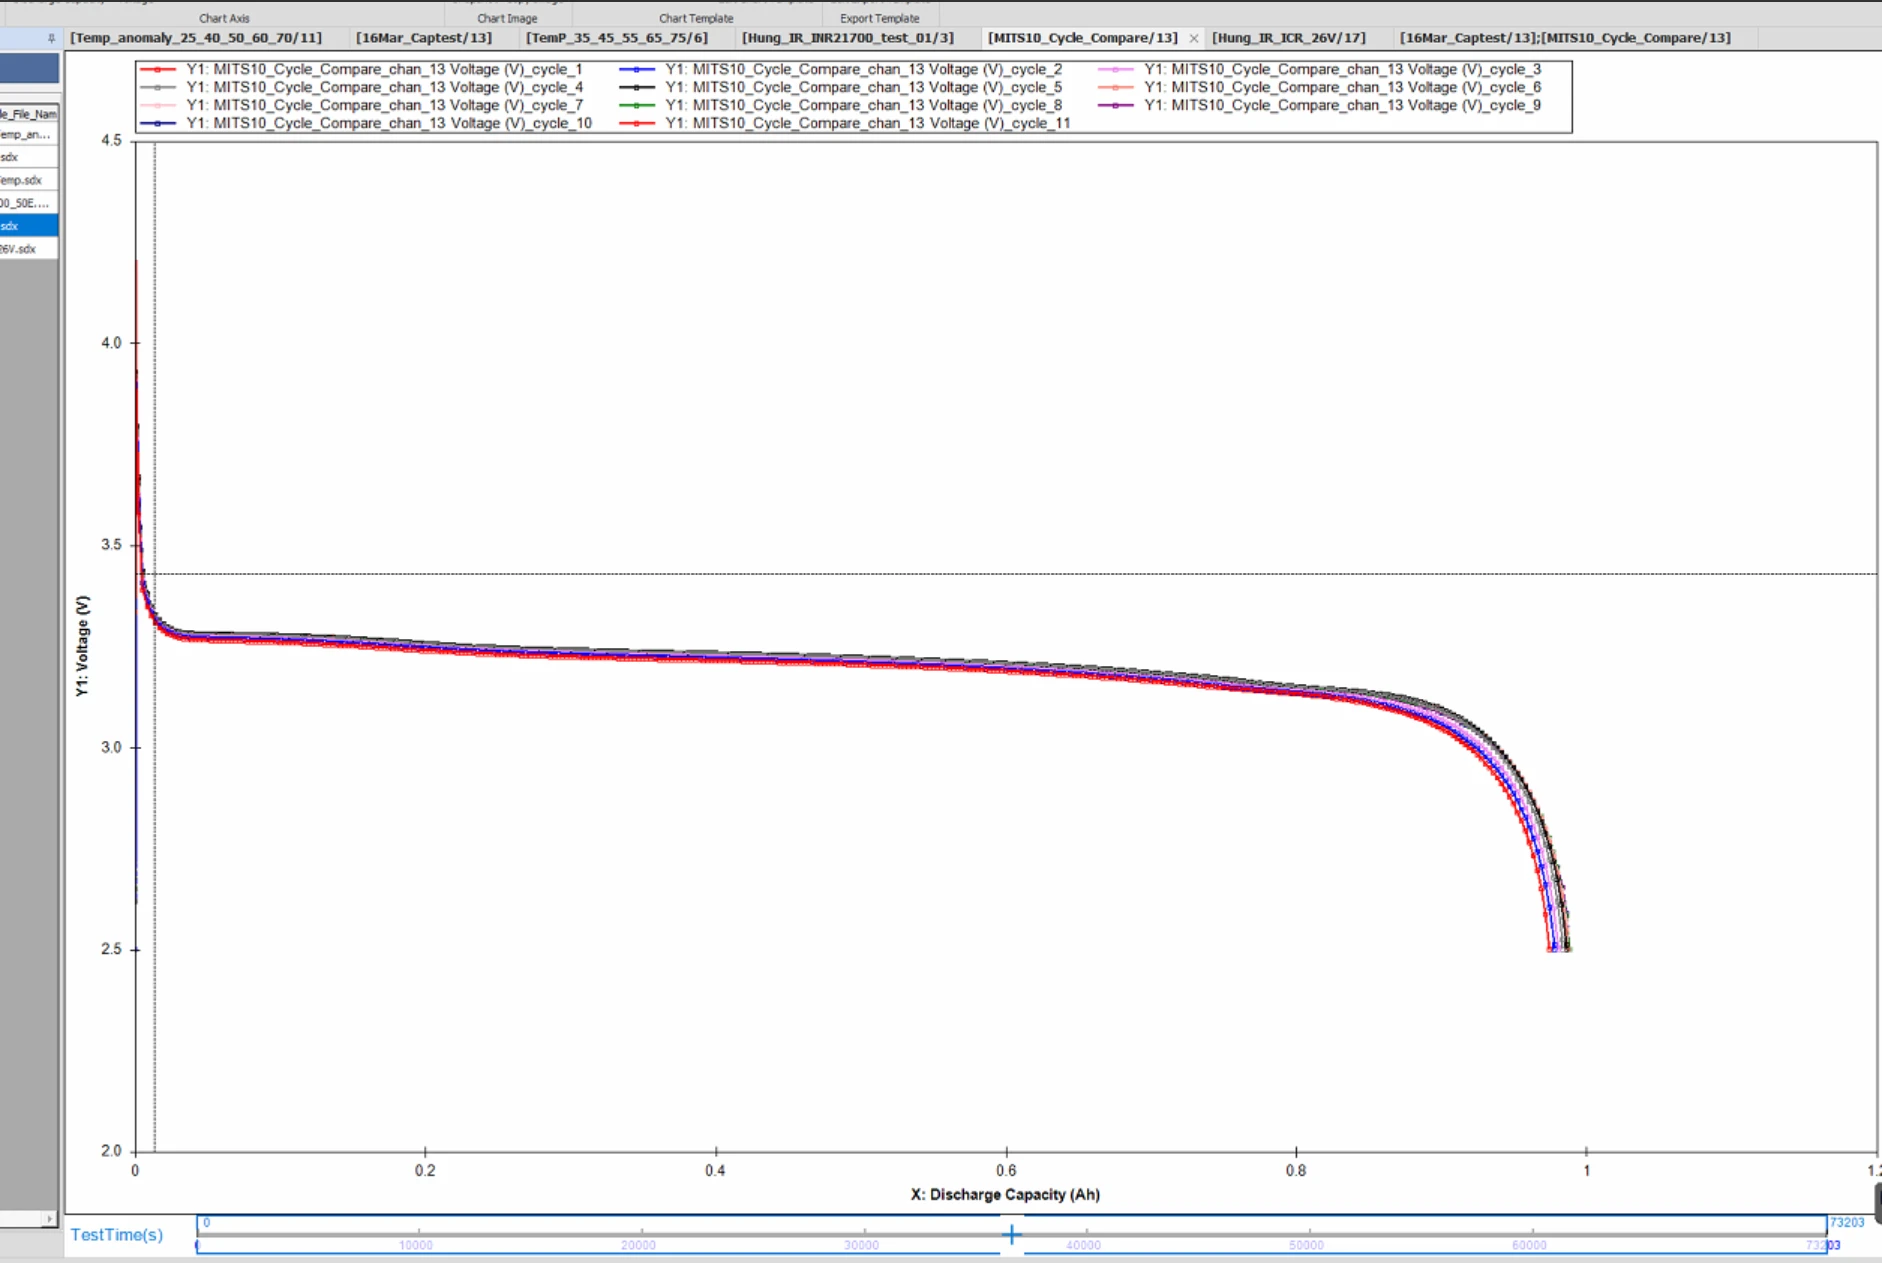
Discharge Capacity vs Voltage in different cycles
The graph can be zoomed in to see clearer:
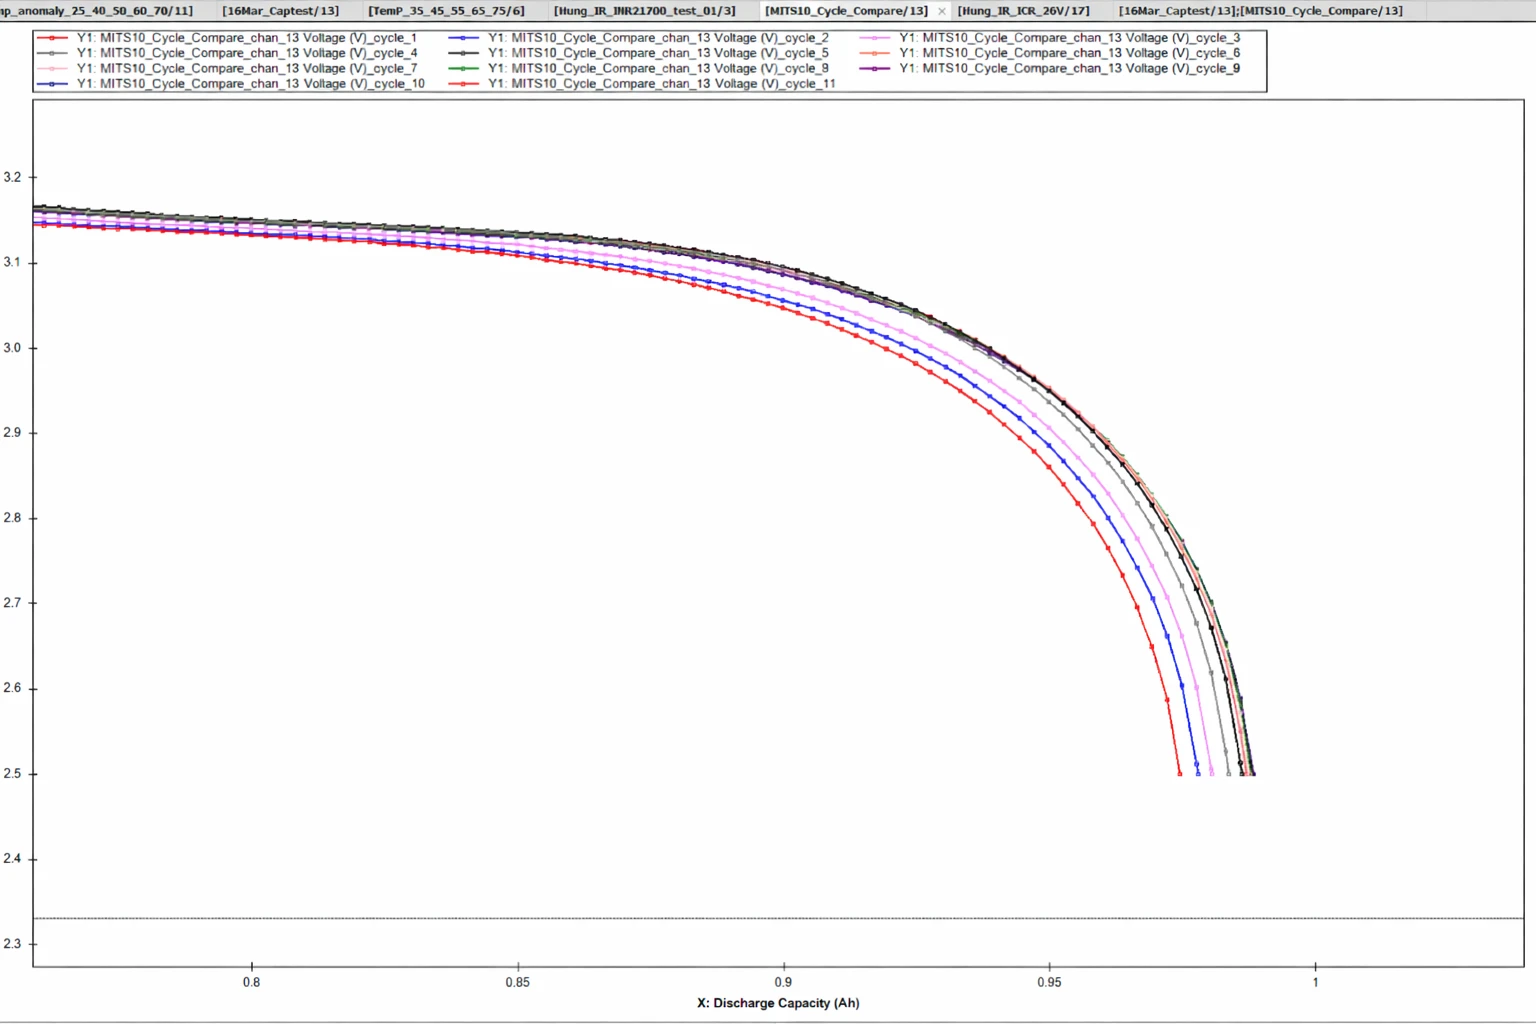
Discharge Capacity vs Voltage in different cycles (zoomed in)

