


1.导言
1.1 Background
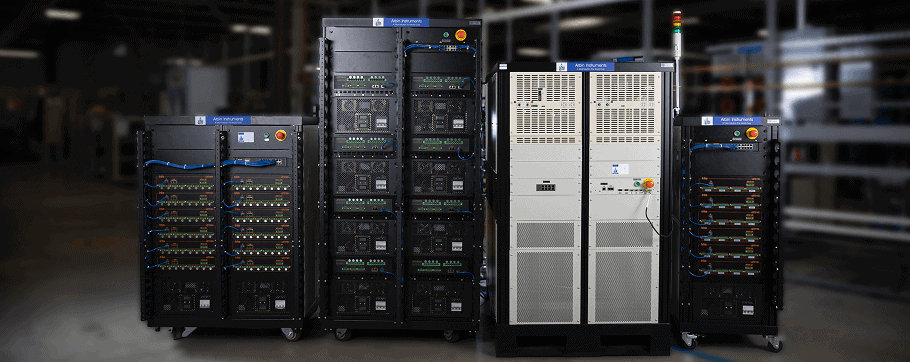
Arbin DataWatcher is primarily used as a real-time data analysis and visualization tool. It allows users to monitor test data, plot curves, and export data files efficiently. It enables users to visualize and analyze key electrochemical parameters such as voltage, current, capacity, and time.
1.2 Purpose of This Application Note
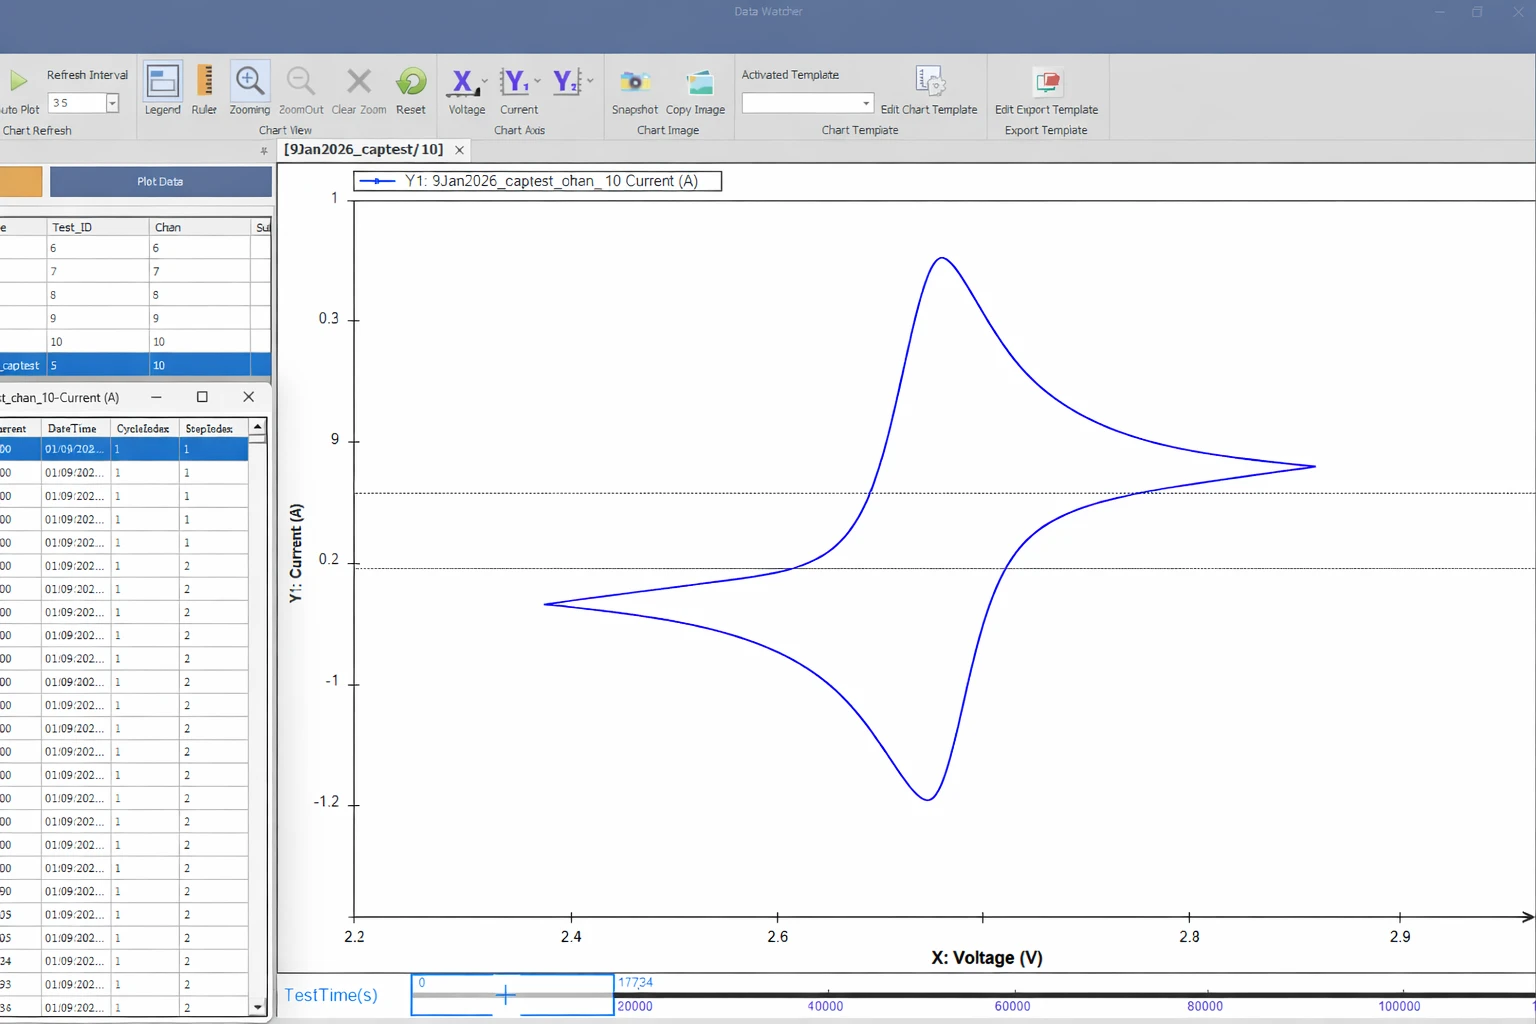
The purpose of this application note is to provide a step-by-step guide on how to plot a Potential vs. Current graph using Arbin Data Watcher. This type of plot is widely used for electrochemical analysis, especially in cyclic voltammetry and polarization studies.
2. Step-by-Step Guide to Plot Potential vs. Current in Arbin Data Watcher
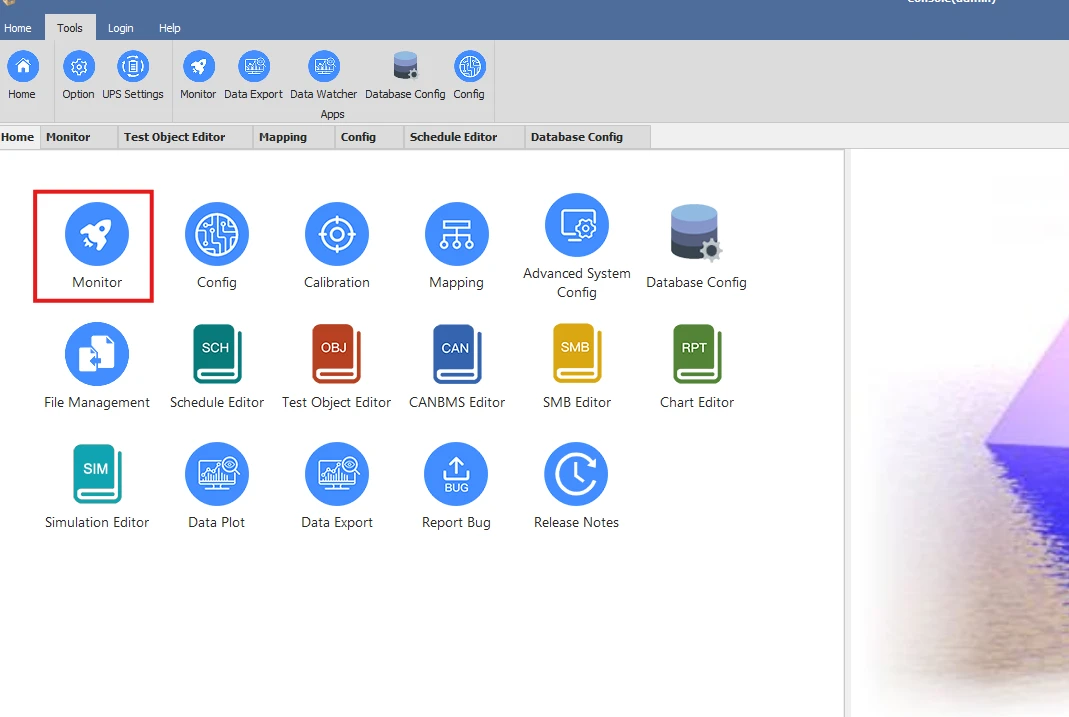
2.1 Open the DataWatcher Interface.
There are multiple ways to open Data Watcher. For example, if you are using MITS 10, there are three methods as follows:
-
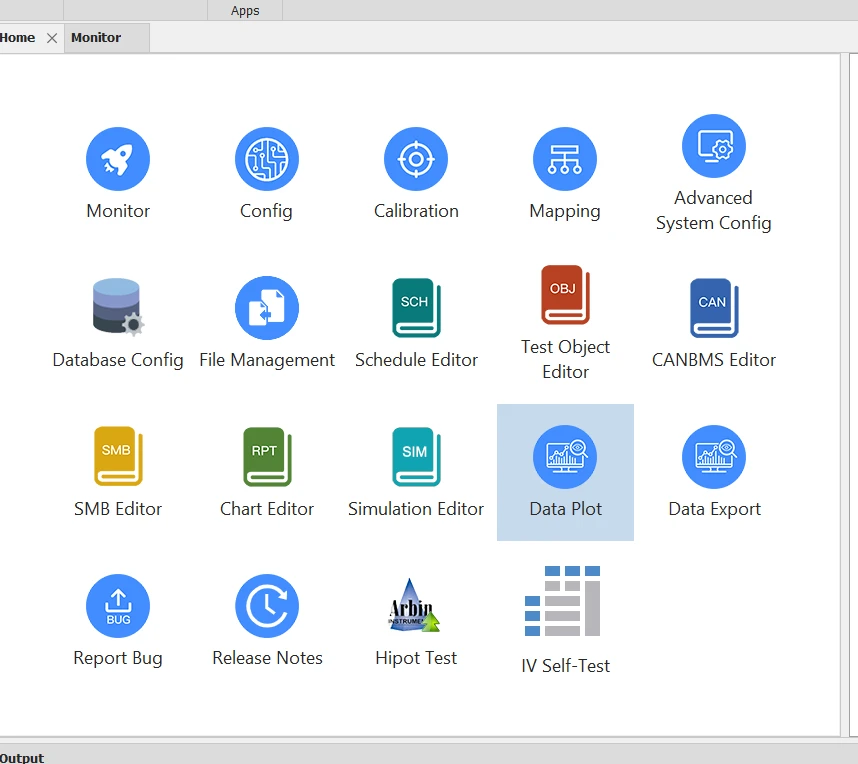
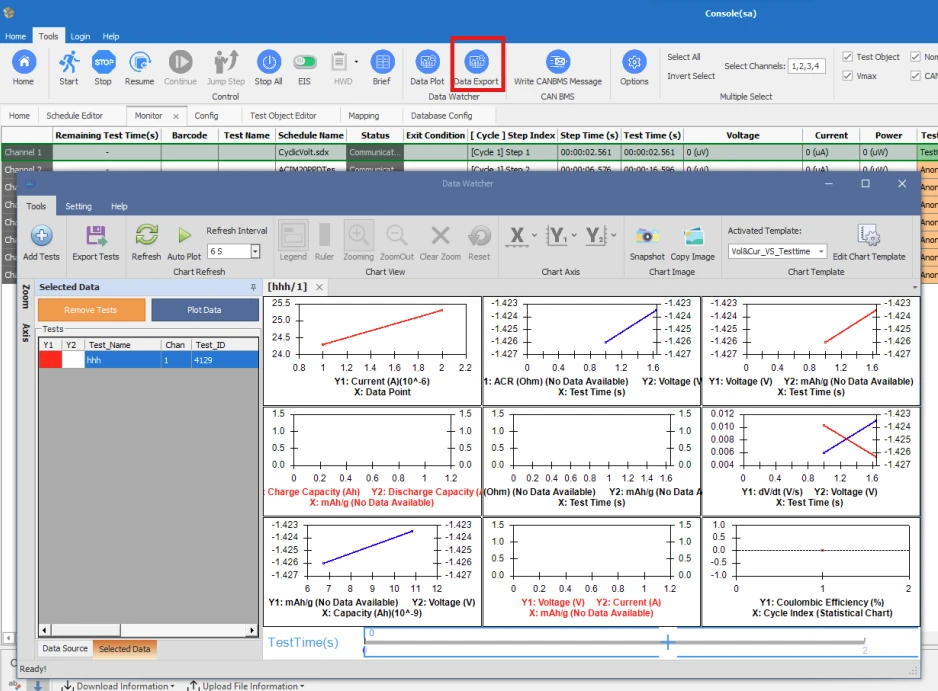
From the MITS 10 home screen, click on the “Data Plot” OR “Data Export” icon
-
From your Desktop, double-click on the DataWatcher icon

-
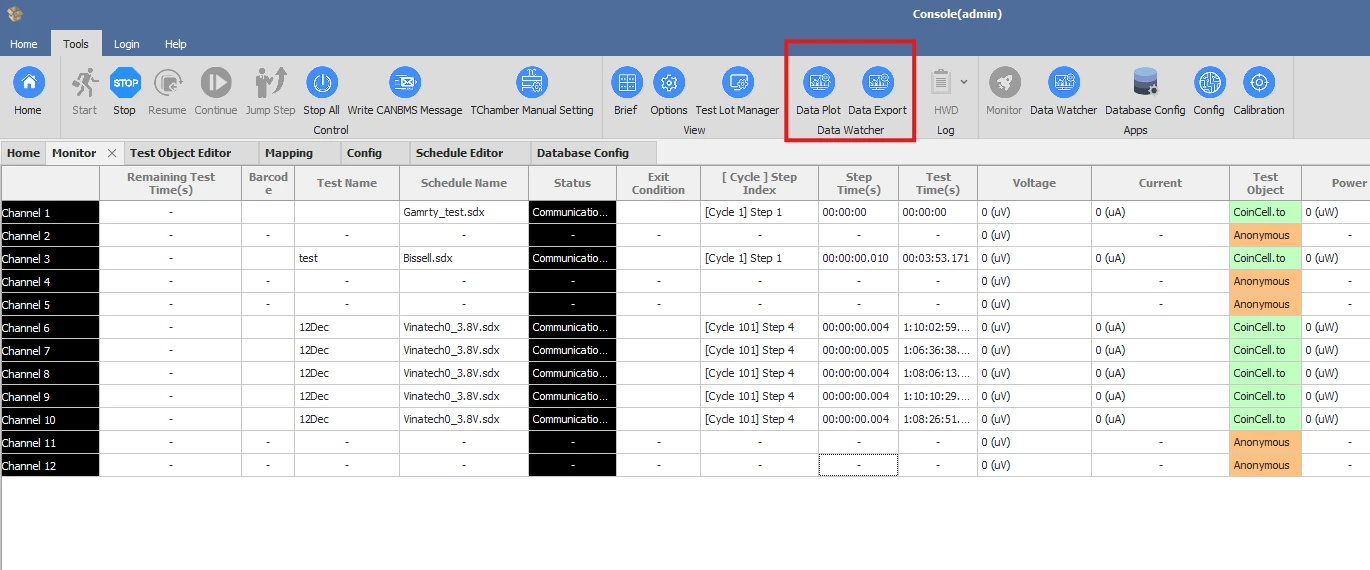
From the Monitor Interface, click on the “Data Plot” OR “Data Export” icon on the Monitor Toolbar.
2.2 Selecting Data Channels
There are three main components to the DataWatcher Interface: The Toolbar ①, the Data Source ②, and the Chart Display ③.
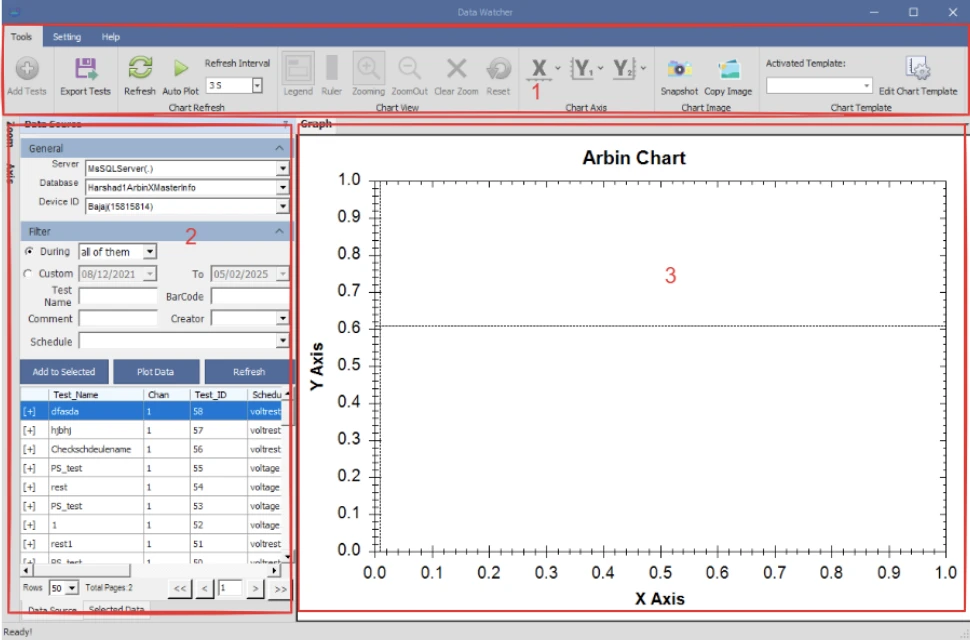
-
Select the test that you want to observe.
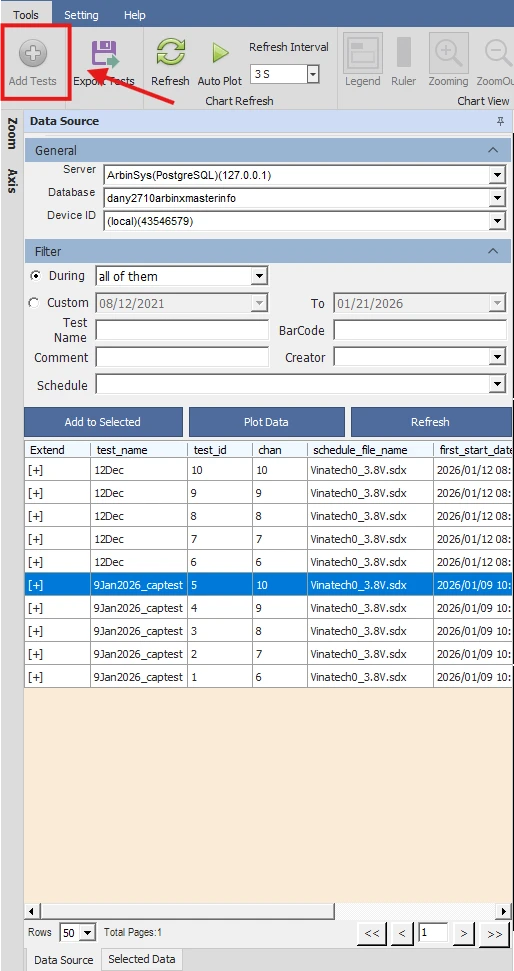
-
Confirm that the test information (e.g., test name, test_id, channel, etc.) is correct.
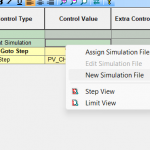
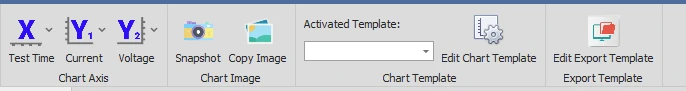
2.3 Customizing the Graph
-
Modify Chart Template
-
Adjust axis scaling
-
X-axis: Current
-
Y-axis: Potential
-
3. Example Result
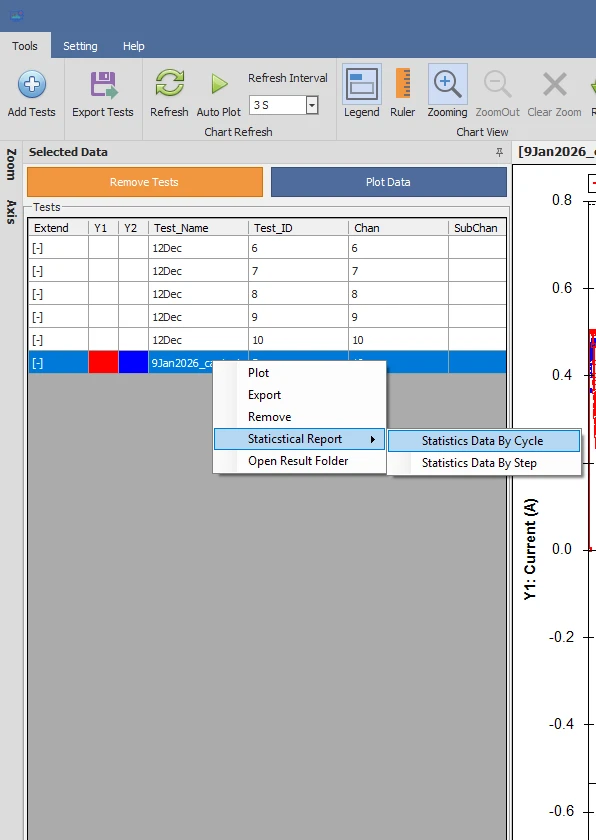
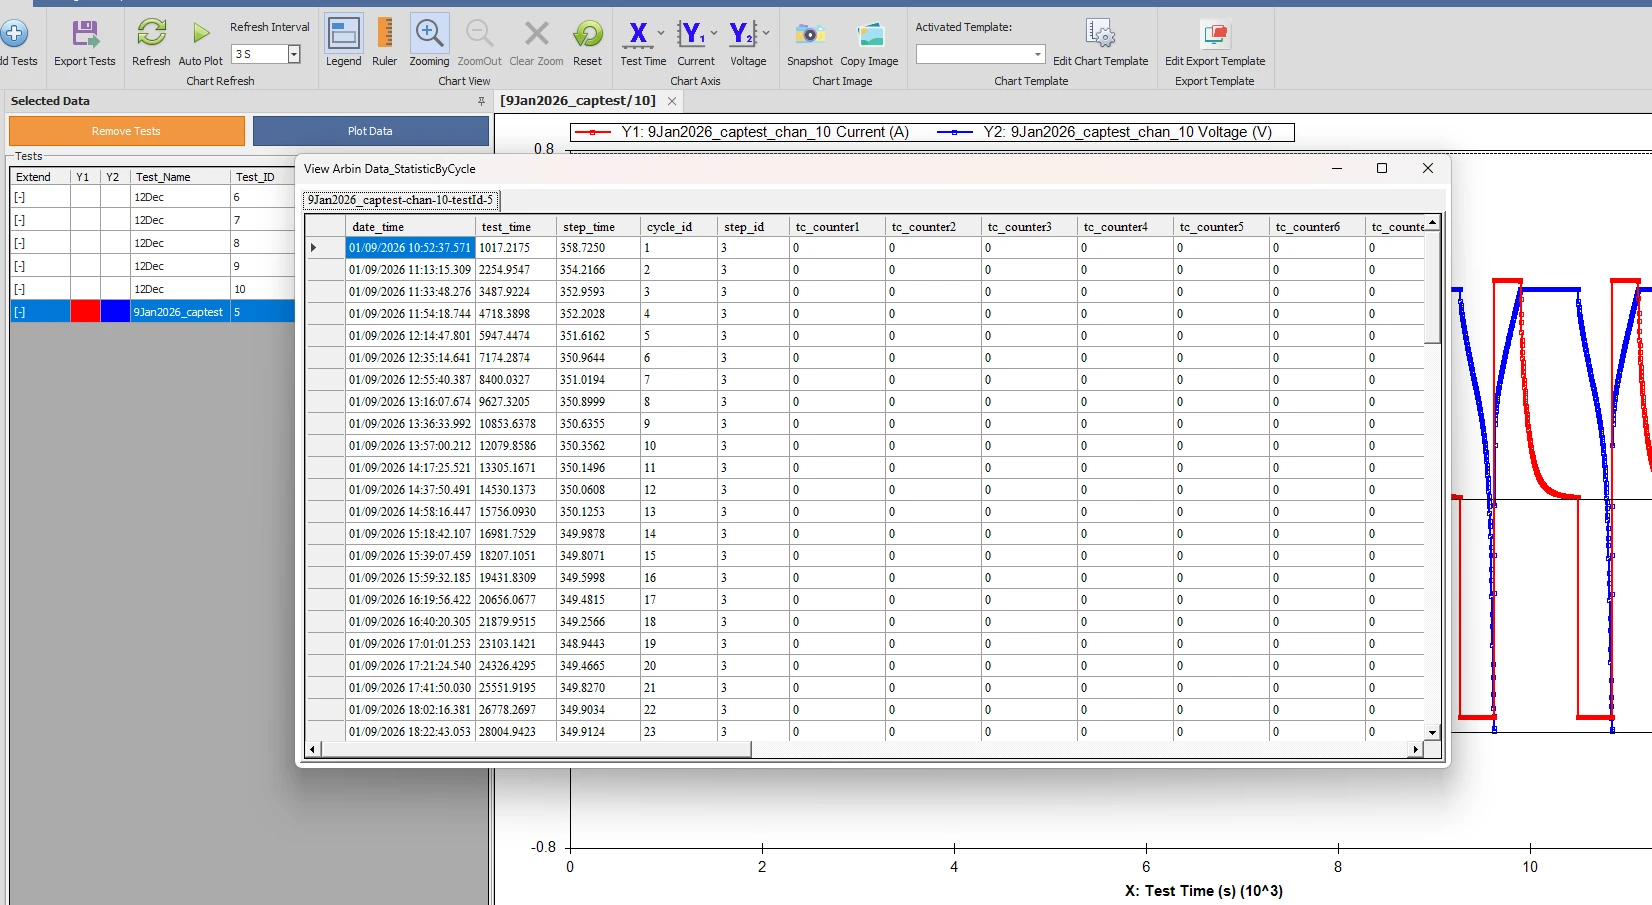
View the Statistics Report
Statistical data is extracted from the last data point of each cycle or step and can be quickly reviewed through the Statistics Report.
1. Open the Selected Data panel of the DataWatcher home screen.
2. Right-click on the test or tests for which you want to view a statistical report.
3. From the menu, select the “Statistical Report” option
4. Data Export
-
Open the Monitor Interface.
-
Left-click the name of a single channel or left-click and drag to select multiple channels.
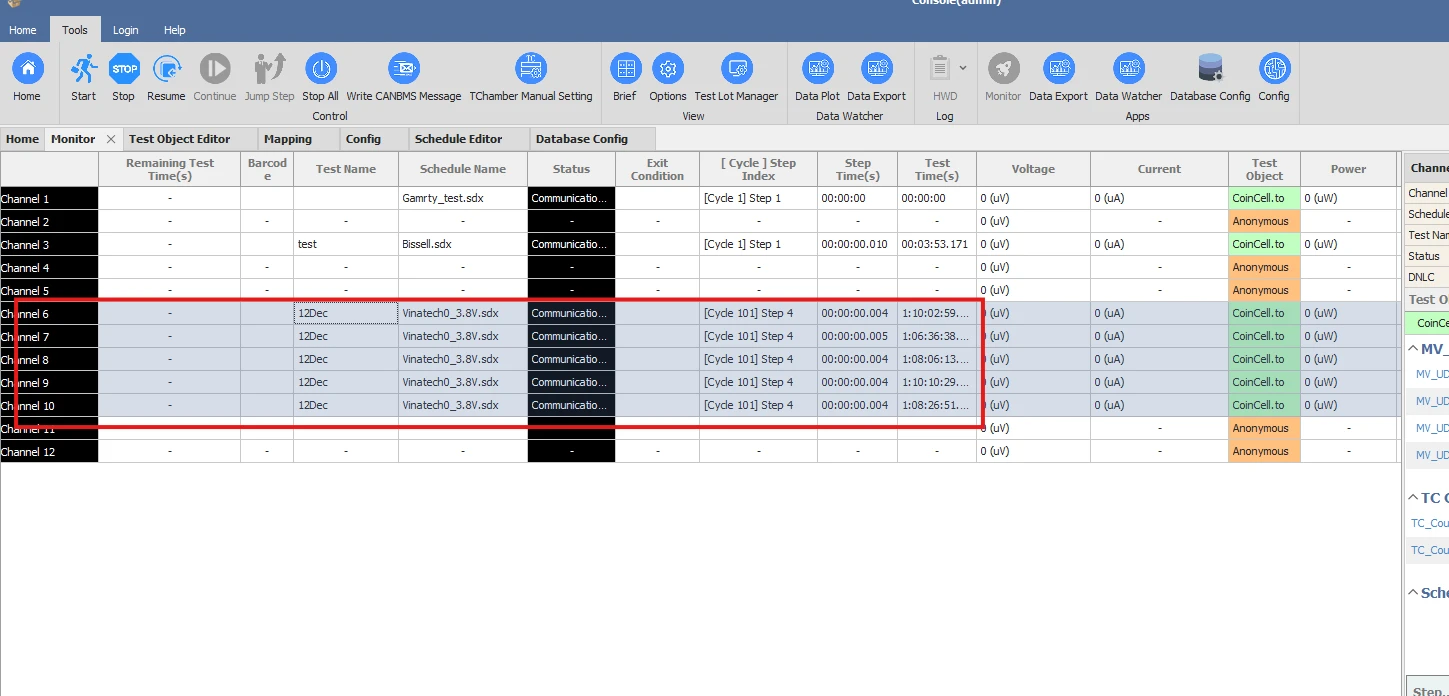
-
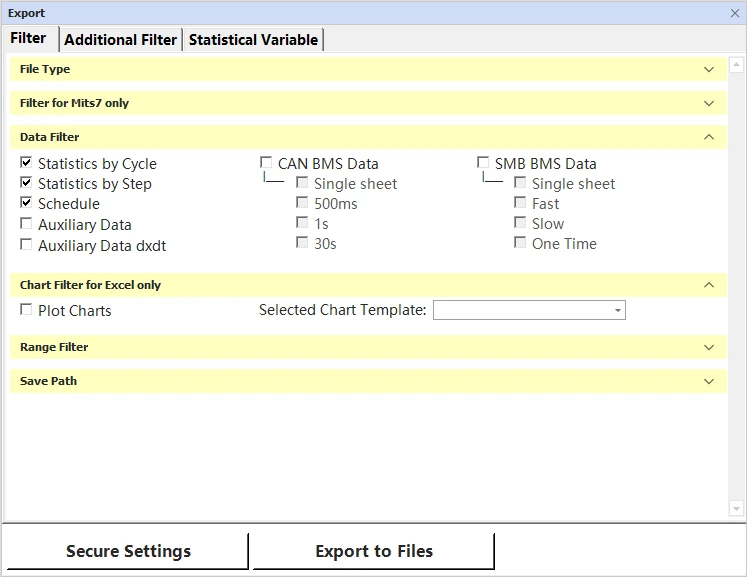
Click the “Data Export” icon in the Monitor Toolbar to open DataWatcher and export respective data
-
In the Export dialog box, configure the export settings according to your needs (e.g., data range, format, output location).
5. Conclusion
This application note demonstrates how to efficiently create a Potential vs. Current plot using Arbin Data Watcher. Proper visualization of electrochemical data helps users better understand cell behavior and improves the accuracy and efficiency of data analysis.

