 한국어
 English
 简体中文

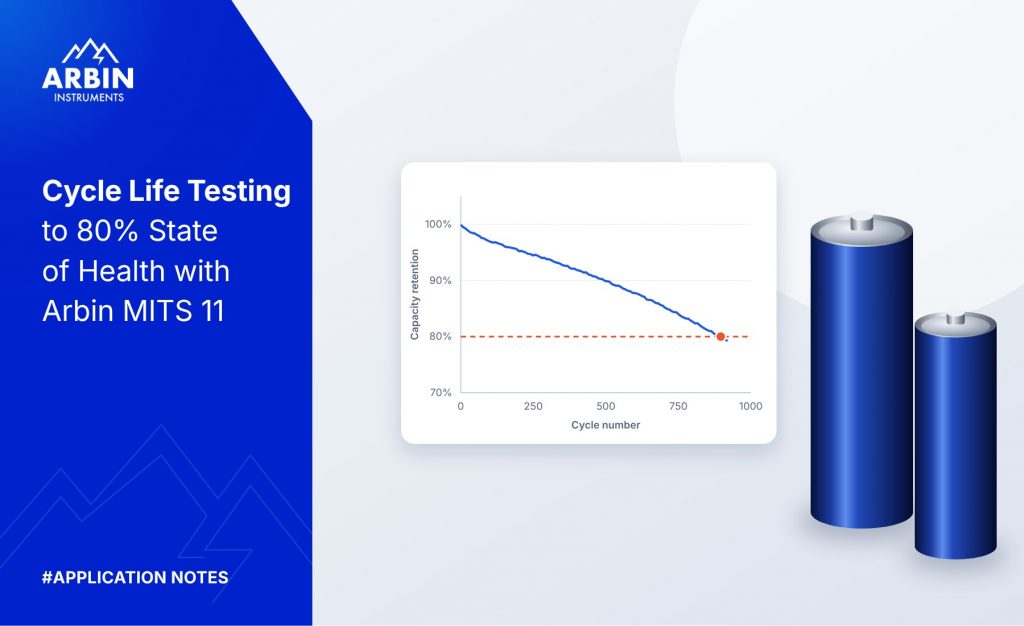
Cycle Life Testing to 80% State of Health
요약
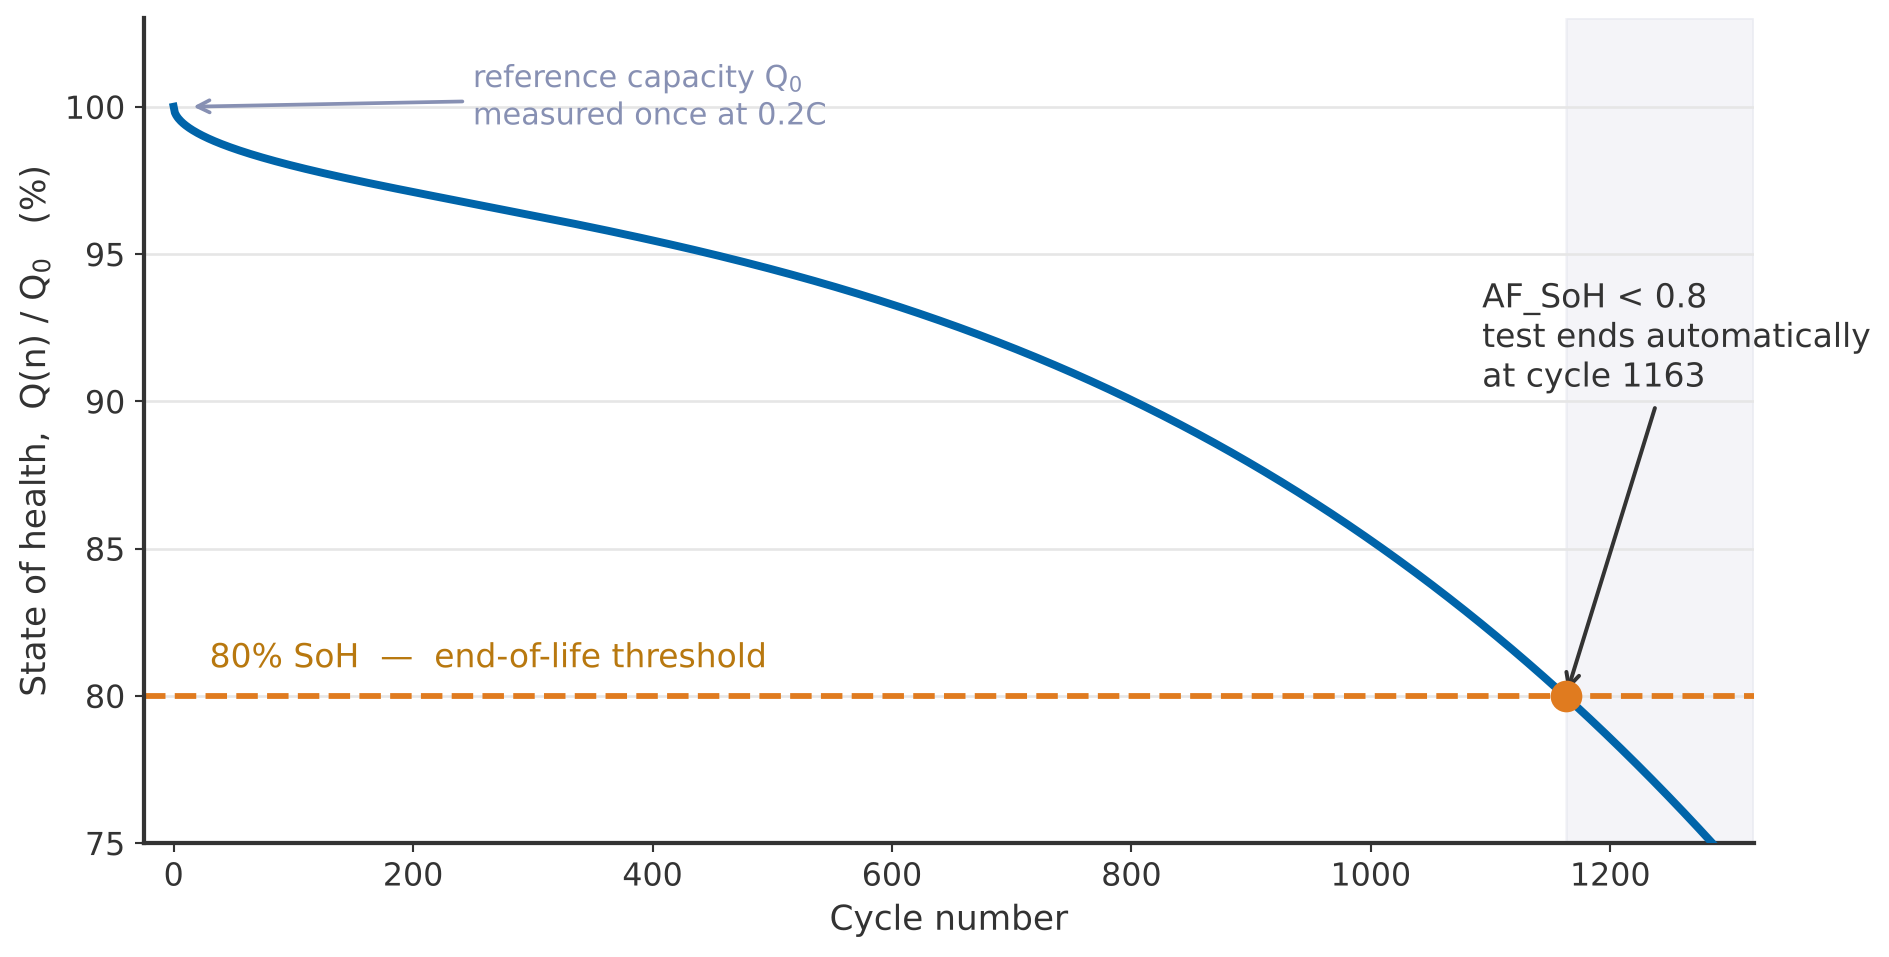
Cycle life is usually reported as the number of cycles a cell completes before its discharge capacity falls to 80% of its initial value. This note shows how to program a test in Arbin MITS 11 that measures the reference capacity, cycles the cell, calculates state of health after every cycle with an advanced formula, and ends the test automatically when SoH falls below 80%. The schedule is available as a template, Cycle_to_80pct_SOH.sdx.
1Why Cycle Life Testing
Capacity fade is the most widely used indicator of lithium-ion cell ageing. It is driven by growth of the solid electrolyte interphase, loss of cyclable lithium and loss of active material [4]. Automotive and stationary-storage test standards therefore define end of life (EoL) as the point at which a cell can no longer deliver a set fraction of its rated or initial capacity — typically 80% [1][2][3].
State of health is defined here as the ratio of the present discharge capacity to the initial capacity measured at the start of the test:
Cycle life testing to 80% SoH is used to:
- compare cell designs, chemistries or suppliers;
- validate warranty and lifetime claims;
- generate ageing data for state-of-health estimation models;
- study the effect of C-rate, depth of discharge or temperature on degradation.
A cycle life test runs for weeks or months and is usually left unattended. The value of automating the end-of-life decision is not convenience — it is that the test stops at a defined, reproducible point rather than whenever someone next looks at the data.
2The Test Method
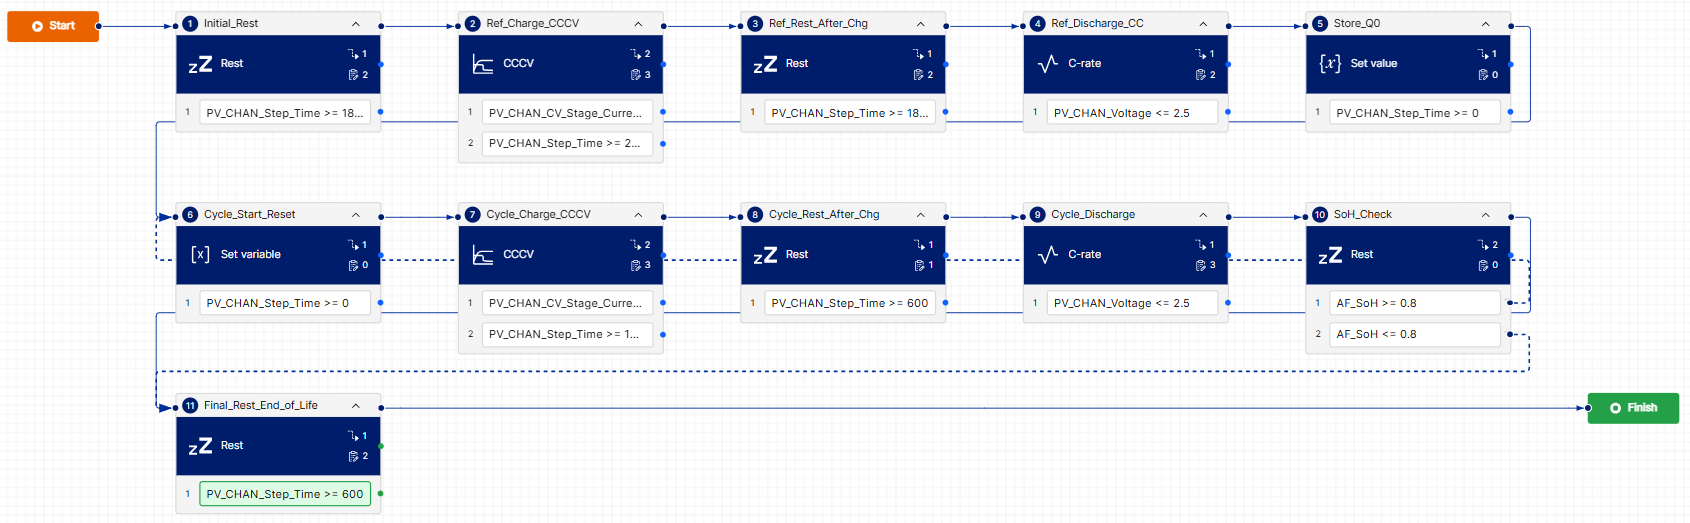
The schedule has two phases. A one-time reference phase measures Q0 at a low C-rate. A cycling loop then repeats charge and discharge at the application C-rate and evaluates Equation (1) after every discharge.
- Reference phase. Rest, CC-CV charge, rest, then CC discharge at 0.2C. The discharge capacity is stored as Q0.
- Cycling loop. Reset the capacity counters, CC-CV charge, rest, then CC discharge at 0.5C.
- End-of-life decision. If SoH ≥ 0.8 the loop repeats; if SoH < 0.8 the test moves to a final rest and ends.
The reference discharge is deliberately slower (0.2C) than the cycling discharge (0.5C). A low-rate discharge gives a capacity close to the cell’s true available capacity, with little polarization in the measurement; the cycling rate is chosen to represent the application. Both rates scale from MV_NominalCapacity, so the same schedule fits any cell.
3Schedule Implementation in MITS 11
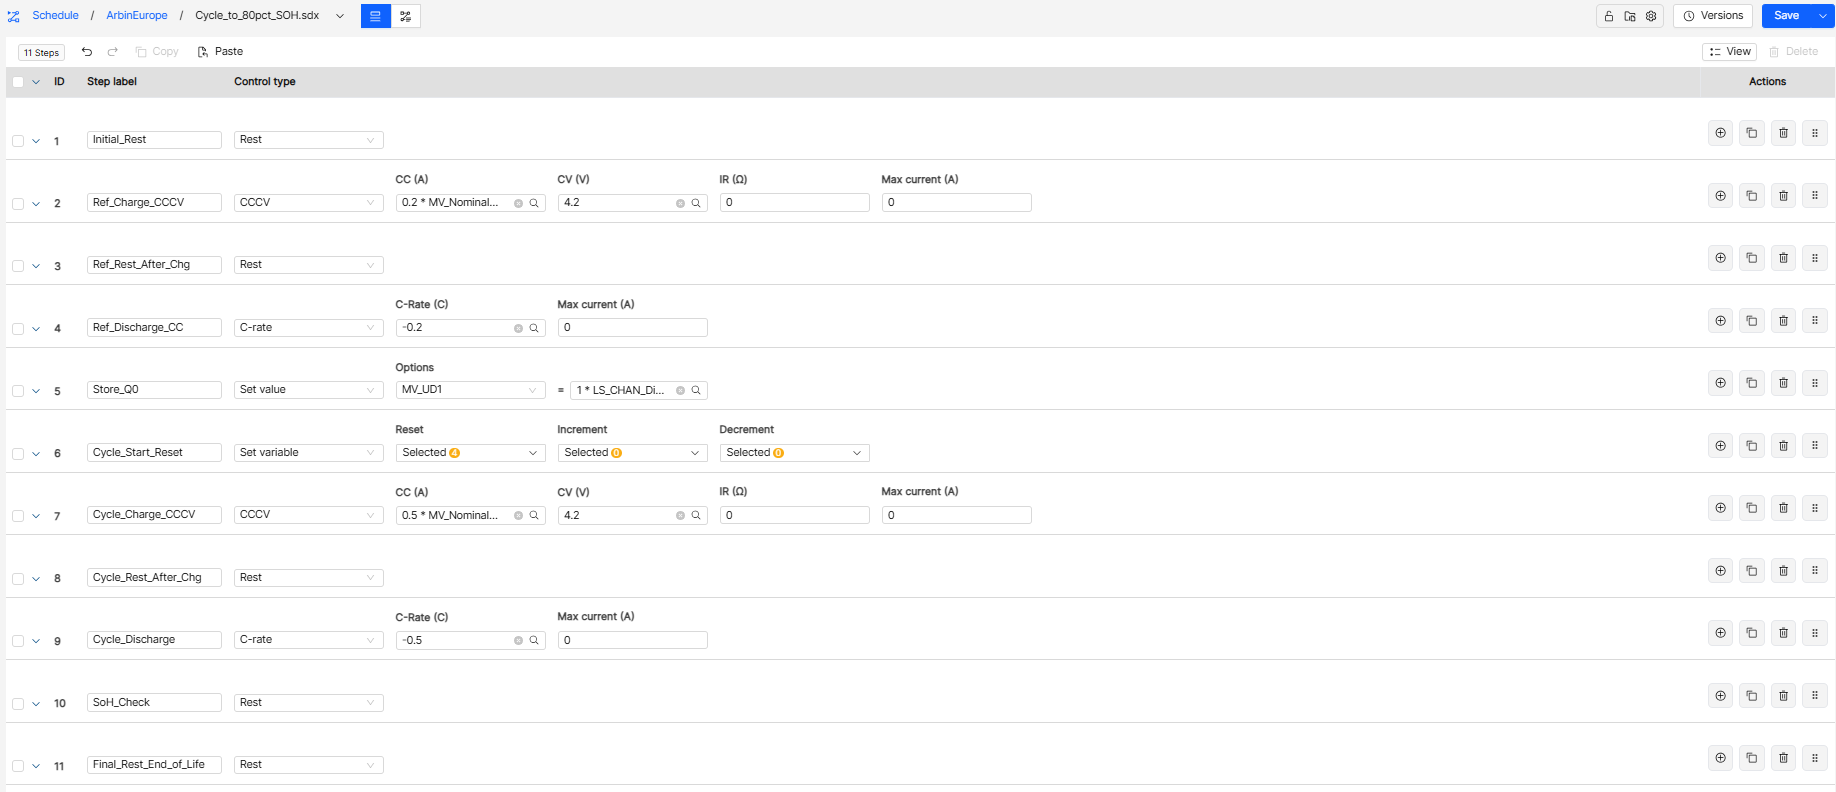
The test was programmed in Arbin MITS 11. Table 1 lists the eleven steps. Nom stands for MV_NominalCapacity 그리고 t for PV_CHAN_Step_Time. The charge time limits in steps 2 and 7 are a backup to the 0.02C cutoff, so a charge cannot sit in CV indefinitely. Set global safety limits for voltage, and for temperature if it is measured, as usual.
Table 1. Schedule steps, transitions and log triggers
| # | Step label | Control type and value | Step transitions → Goto | Log triggers |
|---|---|---|---|---|
| 1 | Initial_Rest | 휴지 | t ≥ 00:30:00 → Next step | DV_Time ≥ 1 min DV_Voltage ≥ 0.005 V |
| 2 | Ref_Charge_CCCV | CCCV: CC 0.2 × Nom, CV 4.2 V | PV_CHAN_CV_Stage_Current ≤ 0.02 × Nom → Next step t ≥ 08:00:00 → Next step | DV_Time ≥ 30 s DV_Voltage ≥ 0.01 V DV_Current ≥ 0.01 × Nom |
| 3 | Ref_Rest_After_Chg | 휴지 | t ≥ 00:30:00 → Next step | DV_Time ≥ 1 min DV_Voltage ≥ 0.005 V |
| 4 | Ref_Discharge_CC | C-rate: −0.2C | PV_CHAN_Voltage ≤ 2.5 V → Next step | DV_Time ≥ 30 s DV_Voltage ≥ 0.01 V |
| 5 | Store_Q0 | Set value: MV_UD1 = LS_CHAN_Discharge_Capacity | Next step | – |
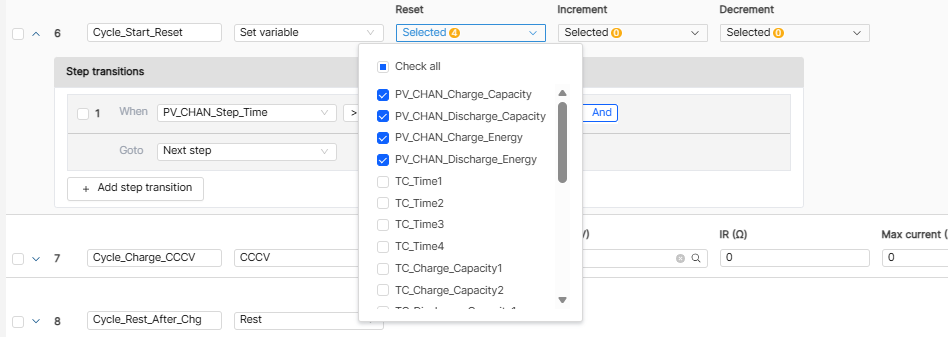
| 6 | Cycle_Start_Reset | Set variable: reset capacity and energy counters; increment cycle index | t ≥ 0 → Next step | – |
| 7 | Cycle_Charge_CCCV | CCCV: CC 0.5 × Nom, CV 4.2 V | PV_CHAN_CV_Stage_Current ≤ 0.02 × Nom → Next step t ≥ 04:00:00 → Next step | DV_Time ≥ 1 min DV_Voltage ≥ 0.01 V DV_Current ≥ 0.01 × Nom |
| 8 | Cycle_Rest_After_Chg | 휴지 | t ≥ 00:10:00 → Next step | DV_Time ≥ 1 min |
| 9 | Cycle_Discharge | C-rate: −0.5C | PV_CHAN_Voltage ≤ 2.5 V → Next step | DV_Time ≥ 1 min DV_Voltage ≥ 0.01 V |
| 10 | SoH_Check | 휴지 | AF_SoH ≥ 0.8 → Cycle_Start_Reset AF_SoH < 0.8 → Final_Rest_End_of_Life | – |
| 11 | Final_Rest_End_of_Life | 휴지 | t ≥ 00:10:00 → End test | DV_Time ≥ 1 min DV_Voltage ≥ 0.005 V |
3.1The Schedule in List View
3.2Schedule Workflow
3.3Step 6: Reset the Counters
Set variable resets the four capacity and energy counters and increments the cycle index, so each cycle is measured from zero. Without this step the counters accumulate across cycles and LS_CHAN_Discharge_Capacity no longer means “the capacity of the last cycle”.
3.4Step 10: The End-of-Life Decision
SoH_Check is a zero-length rest whose only job is to evaluate the advanced formula AF_SoH: at or above 0.8 it starts the next cycle, below 0.8 it jumps to Final_Rest_End_of_Life.
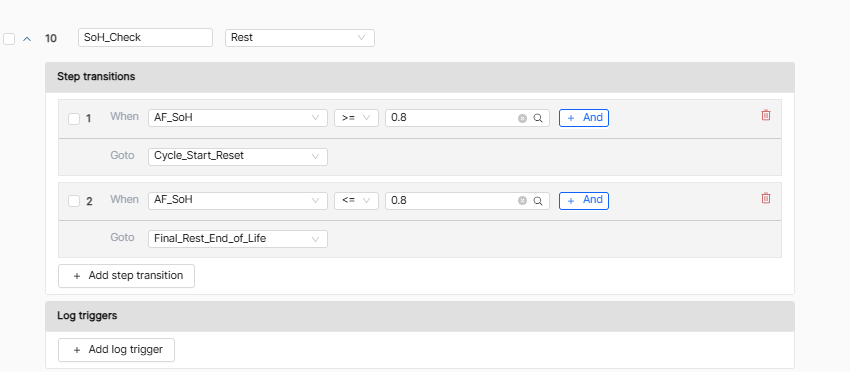
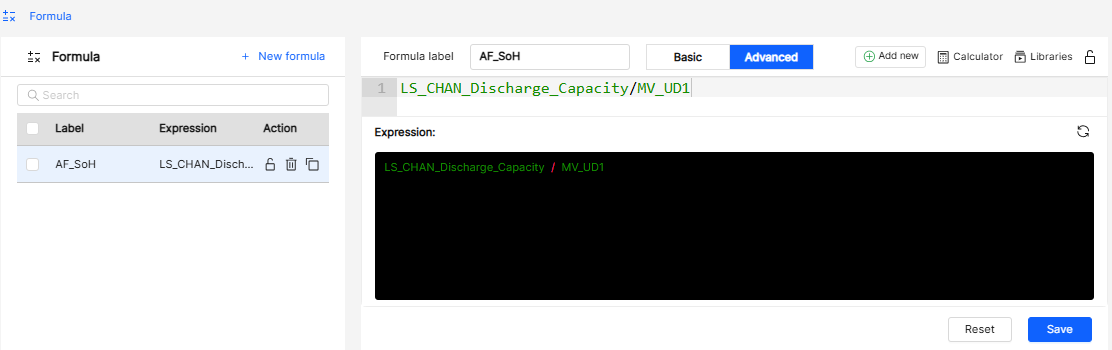
Table 2. Advanced formula AF_SoH
| Formula label | Expression | Meaning |
|---|---|---|
| AF_SoH | LS_CHAN_Discharge_Capacity / MV_UD1 | Last discharge capacity divided by Q0 — Equation (1) |
3.5Creating the Formula
Formula → New formula → Advanced: enter the label and the expression, then save. The formula is stored in the global library (FormulaRoot).
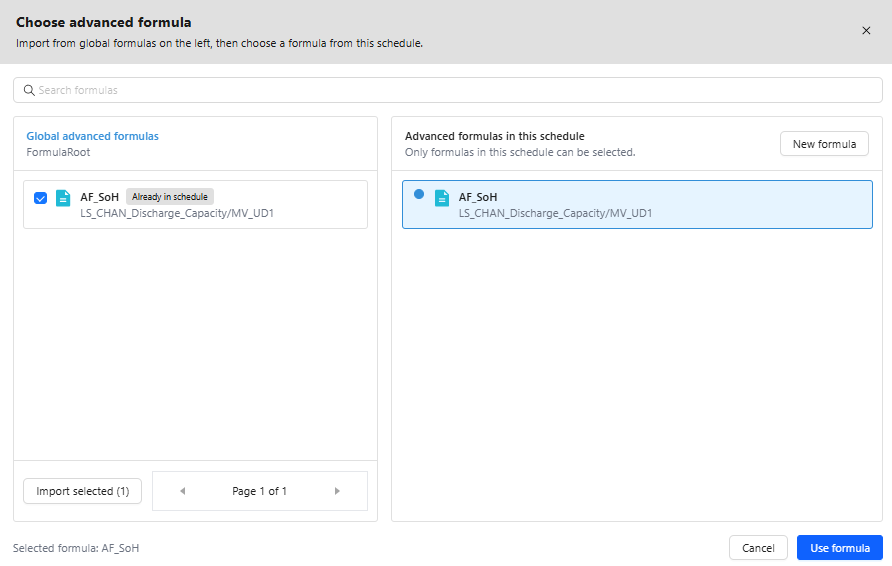
3.6Importing and Reusing the Formula
Choose advanced formula: tick AF_SoH, select Import selected, then Use formula. Because it lives in the global library it can be reused in any other schedule without being rebuilt.
4Running the Test
- Set the capacity and the logging. Enter the cell’s rated capacity in MV_NominalCapacity, and log MV_UD1 그리고 AF_SoH so Q0 and the SoH of every cycle appear in the exported data.
- Test the end-of-life branch first. Set the threshold in SoH_Check to 0.99, run two or three cycles and confirm the test ends by itself — then set it back to 0.8.
- Run the test. The last cycle index in the exported cycle statistics is the cycle life to 80% SoH.
Step 2 is the step worth not skipping. A cycle life test can run for months; a branch that never fires is a fault you would otherwise discover at the end of the experiment rather than on day one. Raising the threshold to 0.99 makes the end-of-life path execute within a couple of cycles.
Optional limits. Add time limits to the discharge steps — 6 h on step 4 → End test, 2.5 h on step 9 — and a maximum cycle index on SoH_Check, so a cell that degrades in an unexpected way cannot leave the channel running indefinitely.
5결론
A cycle life test to 80% SoH can be fully automated in MITS 11 with one advanced formula and two variable steps. Because every current and limit refers to MV_NominalCapacity, the same template works for coin, cylindrical and pouch cells — only the nominal capacity and the voltage window change.
Two instrument properties decide whether a months-long test is worth anything: measurement stability over time, because a slow drift in current or capacity integration appears as capacity fade that is not there; and fail-safe behaviour on power interruption, because a test that loses its counters at cycle 800 has lost the experiment. Arbin systems hold 24-bit measurement at ±0.02% FSR accuracy and ±0.01% precision, with fail-safe recovery after a power interruption [5][6].
For the schedule template or help adapting it to your cell and standard, contact [email protected] or +1 979 690 2751, or see the Arbin cell tester range.
References
- [1]Battery Test Manual for Electric Vehicles, Revision 3, INL/EXT-15-34184. Idaho National Laboratory, June 2015.
- [2]IEC 62660-1:2018, Secondary lithium-ion cells for the propulsion of electric road vehicles – Part 1: Performance testing. Geneva: International Electrotechnical Commission, 2018.
- [3]USABC Electric Vehicle Battery Test Procedures Manual, Revision 2. United States Advanced Battery Consortium, 1996.
- [4]J. Vetter, P. Novák, M. R. Wagner, C. Veit, K.-C. Möller, J. O. Besenhard, M. Winter, M. Wohlfahrt-Mehrens, C. Vogler and A. Hammouche, “Ageing mechanisms in lithium-ion batteries,” Journal of Power Sources, vol. 147, pp. 269–281, 2005.
- [5]Arbin Instruments, “Battery Cell Testers & Cyclers,” arbin.com/battery-test-equipment/cell-testers.html
- [6]Arbin Instruments, “How to Evaluate Battery Test Equipment,” rev. 4, PDF
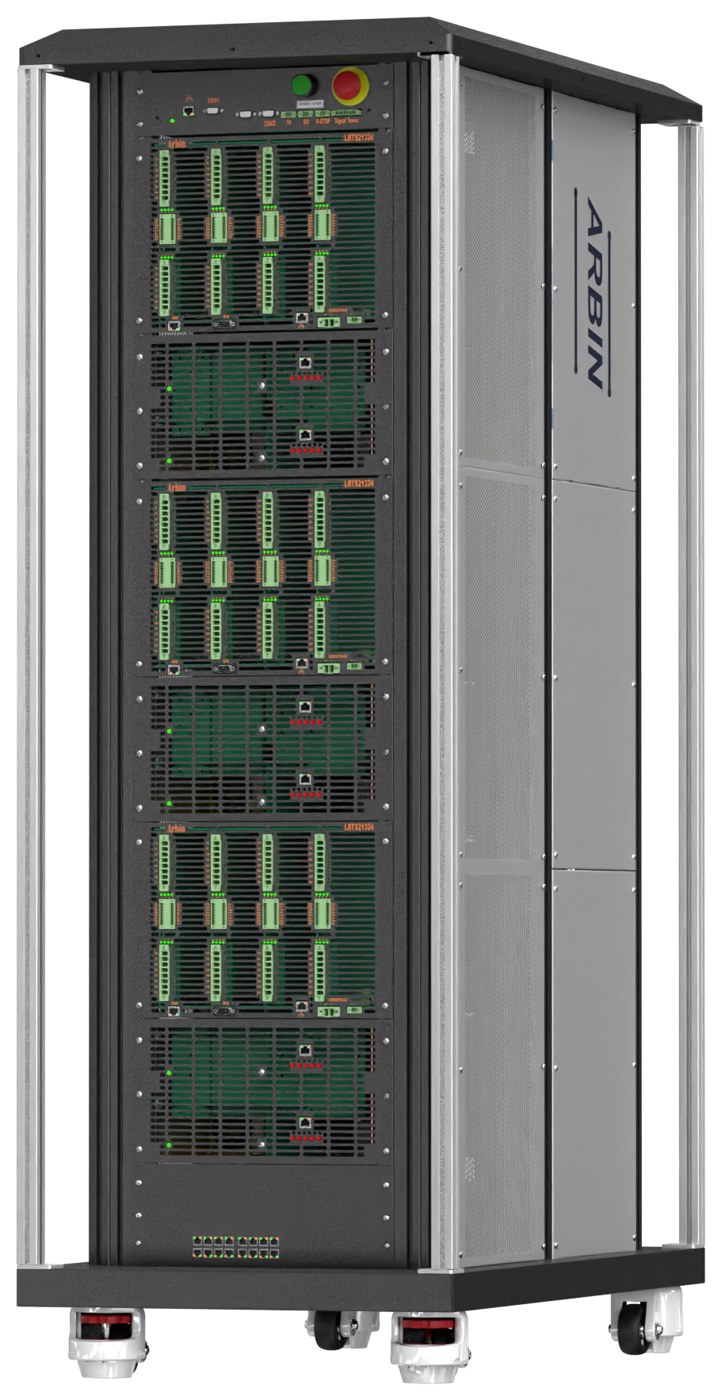
Systems in this note
Arbin Cell Testers
24-bit measurement, ±0.02% accuracy and ±0.01% precision held over months of unattended cycling, fail-safe recovery after a power interruption, and the MITS 11 formula and flow editor used throughout this note.
Planning a cycle life campaign?
Tell us the cell format, capacity, C-rates and how many channels you need. An applications engineer will size the system and send the schedule template.
Related application notes
Ageing, measurement quality and schedule design on Arbin systems.
Battery Cell Grading and Matching
Why measurement precision decides how narrowly cells can be binned.
Read note →What Is Battery Internal Resistance?
Resistance rises as a cell ages — what ACIR, DCIR and R₀ mean.
Read note →What Is a Battery Cycler?
How a cycler works and the specifications that decide data quality.
Read note →Electrochemical Techniques for Battery Research
GITT, PITT, CV and EIS — what each one reveals about ageing.
Read note →